Editor’s Note: We’re hosting an exclusive webinar on March 11 to walk through the findings of this study. Join us live or sign up to receive the recording.
The Problem: For the last few years, companies have been investing inordinate sums into AI tracking and AI visibility for their brands and products. $100M+/yr is already estimated to be spent on this new version of search analytics and yet, I could find absolutely no research showing whether AI tools are consistent enough, when prompted for lists of brand/product recommendations, to produce valid visibility metrics. There are loads of studies about AI accuracy (in fact, we used Carnegie Mellon’s Estimating LLM Consistency: A User Baseline vs Surrogate Metrics as a model for this work), but when it came to answering the question of whether ChatGPT, Claude, or Google AI produce consistent enough lists of results to be usefully tracked… Nothing.
What the heck?! How could any serious executive willingly spend $thousands or $millions at an AI tracking provider without answers to this basic question (and all the dozens of important follow-ups that fall out from it).
The Solution: Rather than remain infuriated every time I saw another brand blow their ever-shrinking marketing budget on “tracking rankings in AI,” I decided to do the research myself (with some help). Patrick O’Donnell is a longtime friend (we play a lot of D&D together), and last year, joined Gumshoe.ai, a Seattle-based startup in the AI tracking sector. Conflict of interest? Well, maybe, but given my starting point as a devout skeptic, already convinced that AI tracking was a boondoggle, Patrick’s calm demeanor, access to millions of AI response data points, and willingness to leverage his math major background and programming skills made for the perfect research partner. And I promise (as you’ll see) that I didn’t pull any punches in interrogating the process.
Our Experiment’s Hypothesis: AI tools produce such randomized lists of recommendations, and user prompts are so highly varied that attempting to track rankings or visibility of a brand/product for a given topic space or user intent is pointless (and brands with too much money should just pay ChatGPT, et al. for the impressions data in their upcoming ads products).
Step One: Ask a bunch of folks to run the same AI prompts over and over, recording their results.
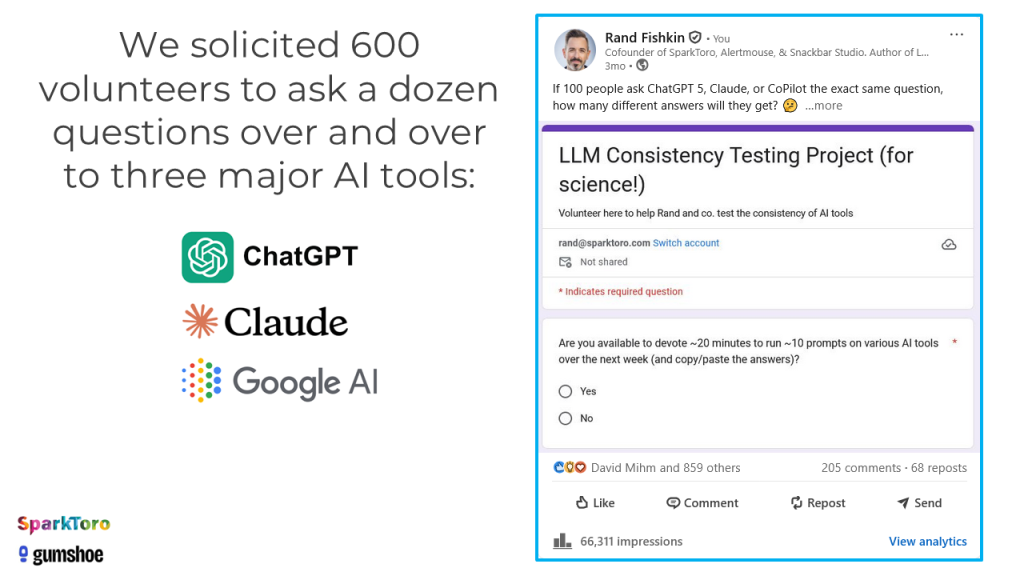
We chose the three most popular AI tools in the US: ChatGPT, Claude, and Google search’s AI Overview (and AI Mode, if/when AI Overviews didn’t show). 600 volunteers ran 12 different prompts through each of the 3 tools a combined 2,961 times. They copied and pasted the AI tool responses into survey forms, which Patrick (and my new Chief of Staff, Kristy Morrison) normalized into ordered product/brand results.
Just how diverse were those lists of brands?
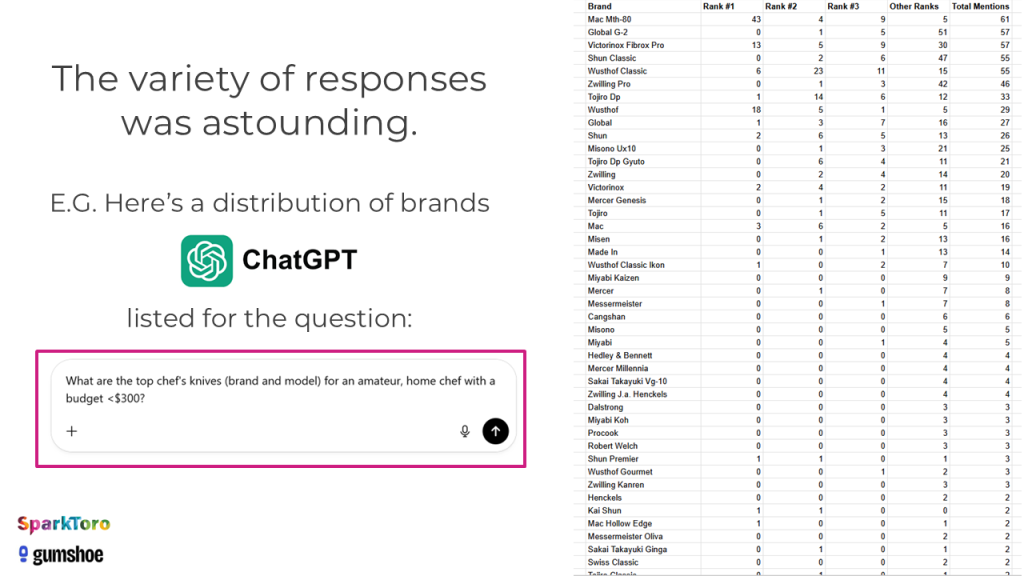
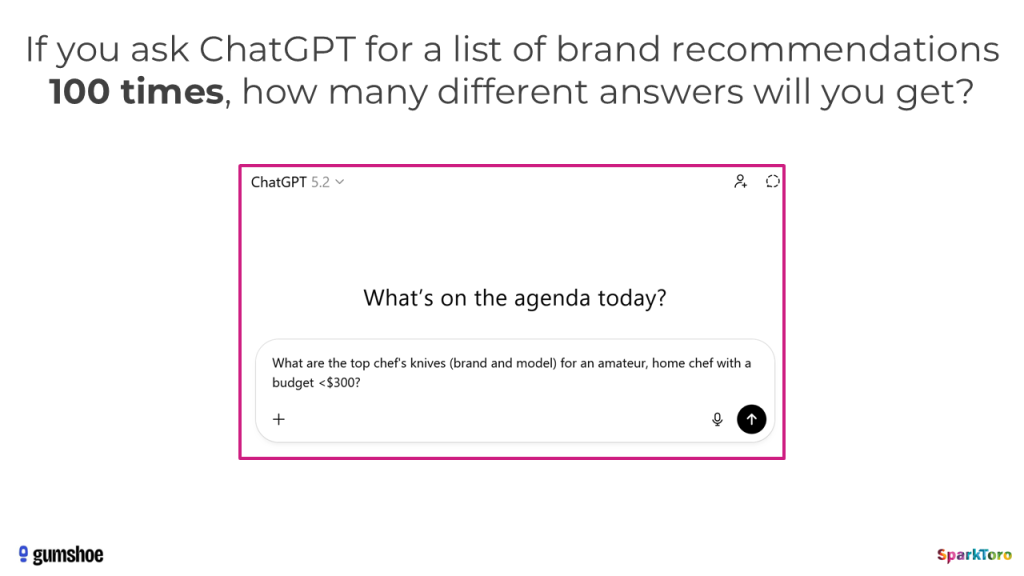
The prompt from the screenshot above (What are the top chef’s knives, brand and model, for an amateur home chef with a budget <$300?) is one of the twelve we chose in the B2C product category. We attempted to cover multiple sectors and a variety of differently-sized spaces, meaning those where a larger or smaller group of brands/products were likely to be recommended.
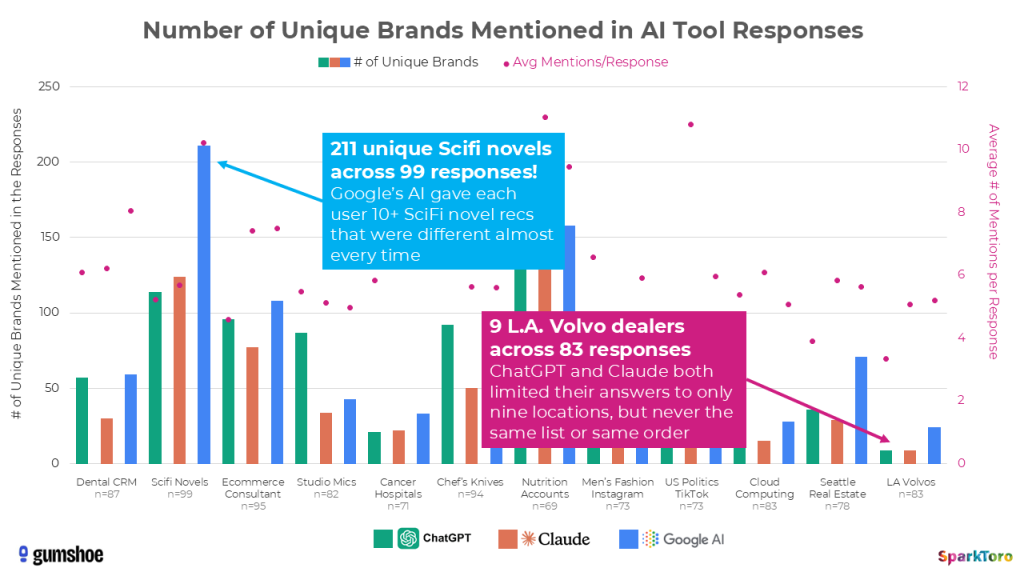
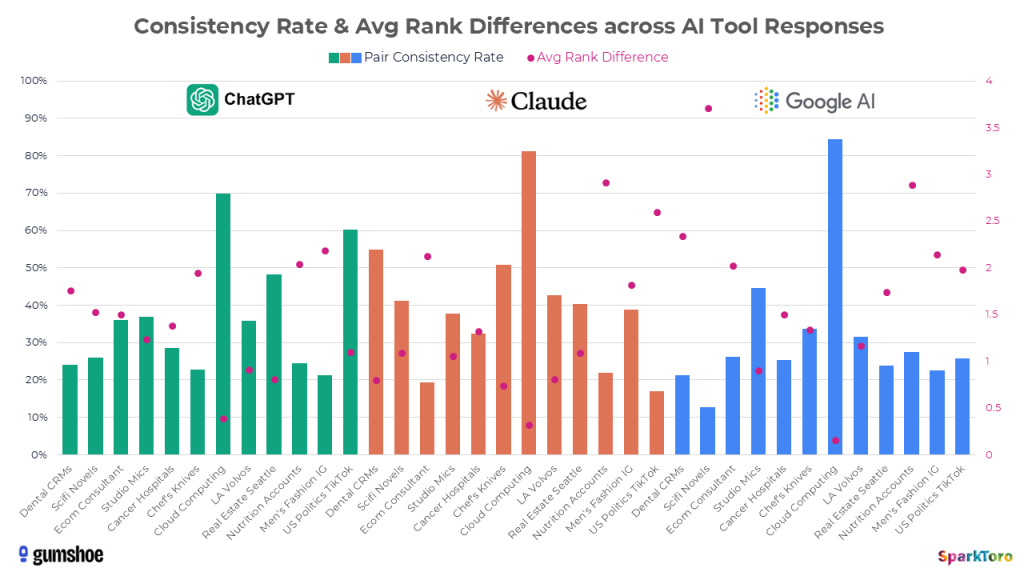
Below, I’ve visualized the massive variety of brand/product listing combinations all 12 different prompts, run 60-100X each, produced:
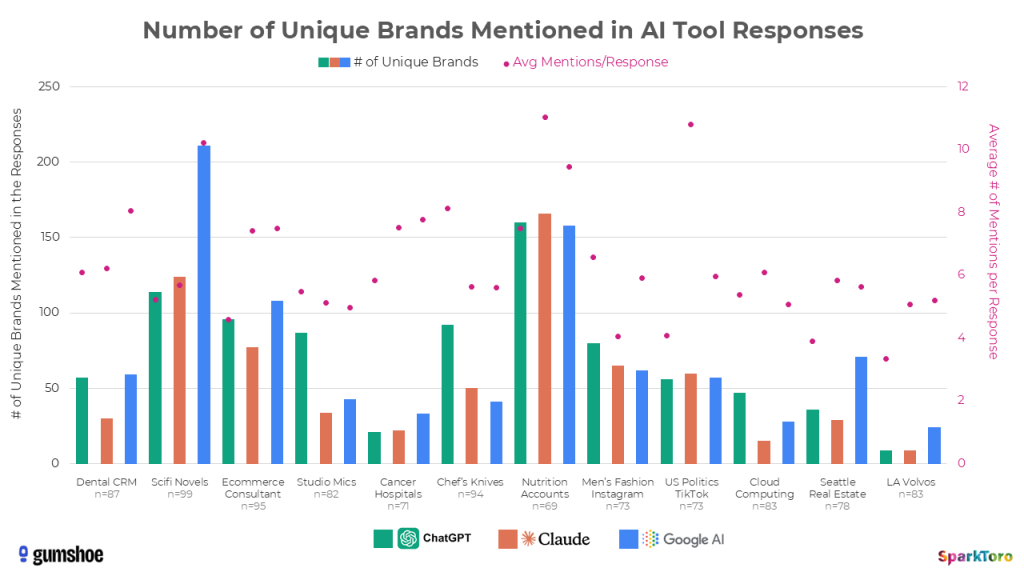
What you’re seeing with the green (ChatGPT), orange (Claude), and blue (Google AI) bars is the number of unique brands, products, and entities recommended by the AI response to the prompts. The range appears to be all over the place, but is in fact closely tied to how many entities frequently appear in documents in the AI corpora around the topic (e.g. there are less than a dozen Volvo dealerships in Los Angeles, but thousands of recently-published Science Fiction novels). Those pink scatterplot-style dots, meanwhile (graphed on the secondary axis) show the average number of responses the AI tools gave (another factor complexifying the ranking/visibility problem).
If you ask an AI tool for brand/product recommendations a hundred times nearly every response will be unique in three ways:
- the list presented
- the order of the recommendations
- the number of items on that list (sometimes the AI gave as few as 2-3 recommendations, and equally often 10 or more)
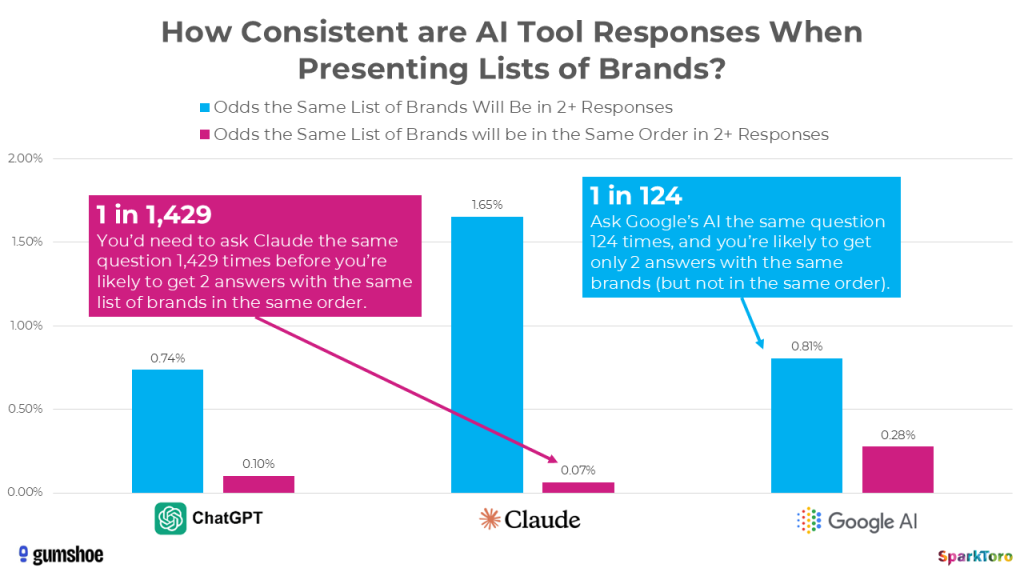
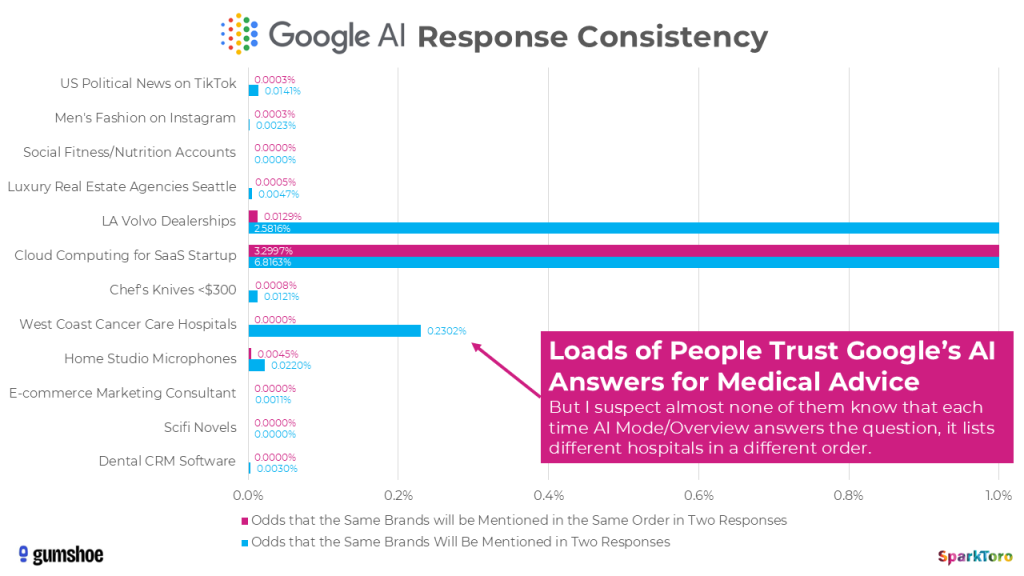
Just how inconsistent are these AI tools when presenting lists? This graph tells a compelling story:
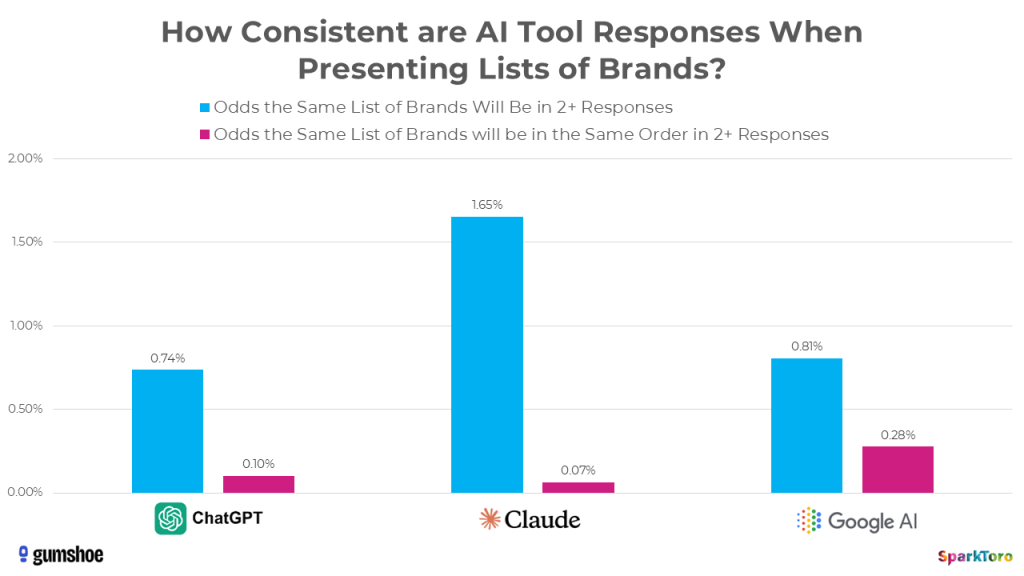
To get mathematical about it, there’s a <1 in 100 chance that ChatGPT or Google’s AI, if asked 100X, will give you the same list of brands in any two responses. Claude is just slightly more likely to give you the same list twice in a hundred runs, but even less likely to do so in the same order.
In fact, when it comes to ordering, AI tool responses are so random that it’s more like 1 in 1,000 runs before you’d see two lists in the same order. And we didn’t even try to collect data on how the AIs described each brand or how positive/negative sentiment was around the recommendation.
The bottom line is: AIs do not give consistent lists of brand or product recommendations. If you don’t like an answer, or your brand doesn’t show up where you want it to, just ask a few more times.
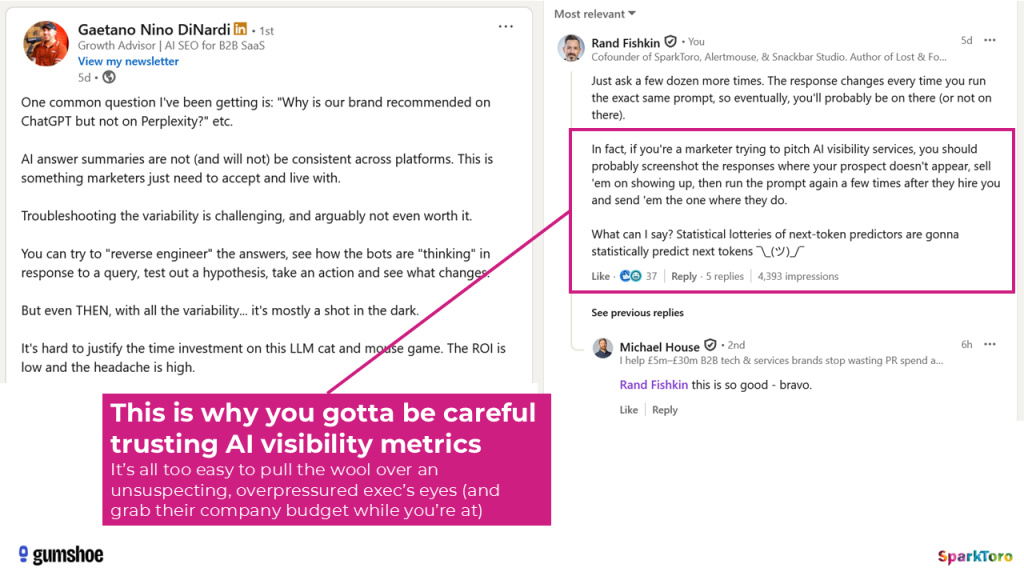
As I pithily pointed out on Gaetano DiNardi’s LinkedIn post last week, AI visibility “experts” could easily weaponize this knowledge, just as sketchy SEO salespeople did in decades past. Buyer beware.
To put an even finer point on it, let’s imagine an awful scenario in which it’s absolutely essential to get the best information possible: a cancer in the family. You race to Google’s AI Mode and ask for the best cancer care hospital on the US West Coast, willing to travel and pay whatever it takes to get the best odds for your loved one.
But when Google gives back a response (in the AI Overview or AI Mode), the list, as thoughtful and well-sourced as it may seem, is so randomized that even if you ran the prompt hundreds of times, you’d likely never see the same list, in the same order, twice.
I truly believe that AI tools should include a disclaimer whenever they give a list of recommendations noting that each run produces randomized selection and ordering from a statistical lottery of candidates. These are not endorsements. They’re not ordered or chosen by any set of criteria other than the spicy autocomplete of AI modeling: tokens that follow other tokens frequently in the corpus (and/or in the extracted results when RAG is used).
When it comes to trusting AI answers, researchers have shown compelling numbers for factual statements in topics like news, politics, science, history, etc. in the high 90%s. But I could find no such similar analysis around the recommendations AI gives when asked for the best brands or products in a sector. Yet, I’m certain millions of people are extending the same trust they gave AIs on facts to the realm of product recommendations, oblivious to the AI’s process or its inconsistency.
Is there any way to order this randomized chaos?
Random lists. Random orders. Random numbers of results. And we haven’t even touched on prompt variability yet, but… the short answer to the question of whether any metric makes sense is (in a shocking twist) yes. In fact, my hypothesis that AI brand answer lists are so random as for tracking to be entirely useless was (probably) wrong. Here’s how I came around:
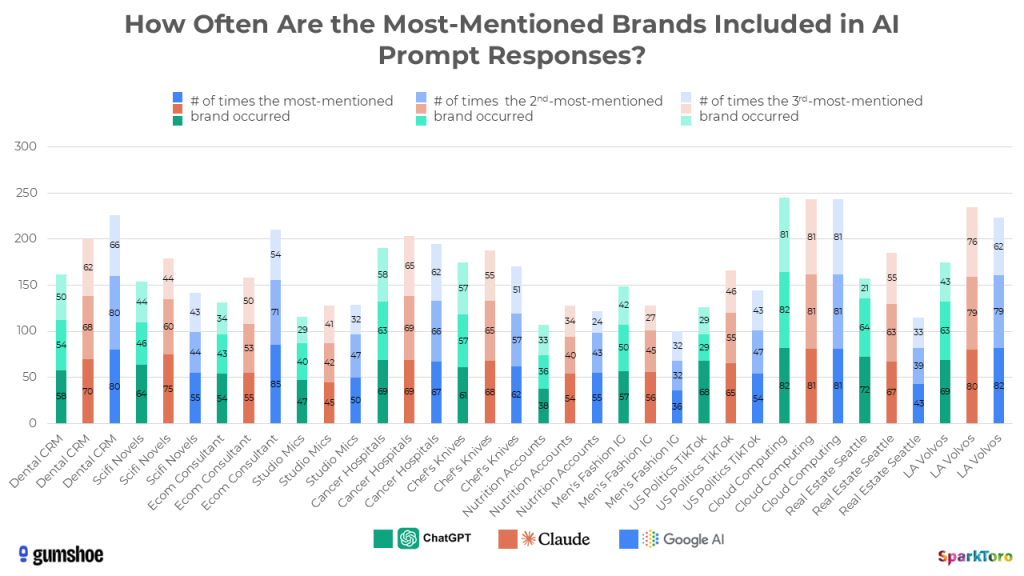
Those numbers you see in the green, orange, and blue bars show how many times the 1st, 2nd, and 3rd-most mentioned recommendations appeared in the responses for each prompt and model set. For example, when Google’s AI was asked to recommend digital marketing consultants with expertise in e-commerce, the Smartsites agency appeared in 85 out of the 95 responses.
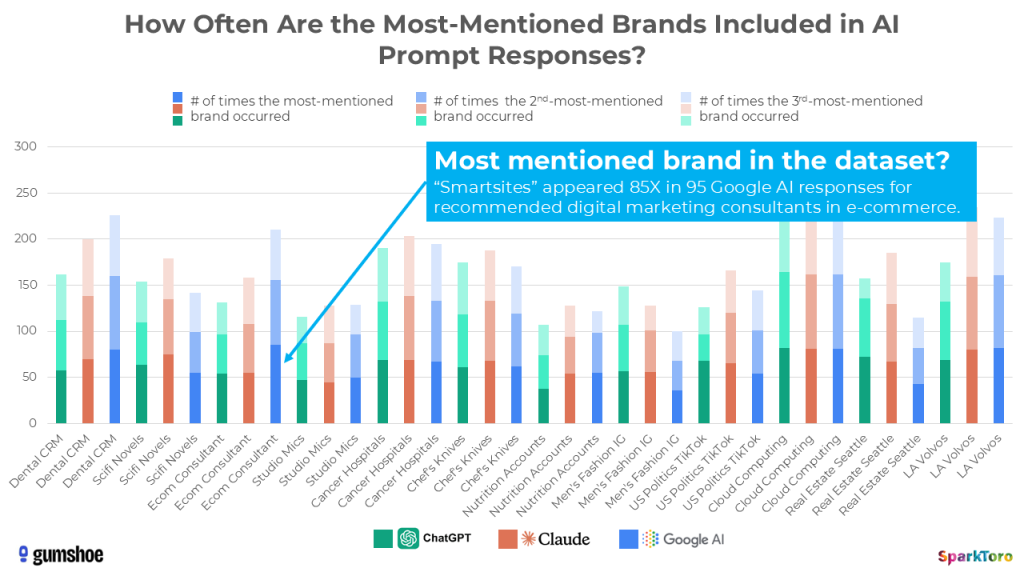
That’s meaningful.
Even if rankings are random to the point of near-uselessness, appearances across dozens or hundreds of runs of the same prompt indicates a set of brands that the AI’s system generally associates more (or less) as a good answer for the prompt intent. Measuring that percent visibility is (probably) a reasonable way to know how prominent or invisible your entity is within the AI’s consideration set.
Another example — men’s fashion influencer Adam Gallagher only came up 36X in the 73 responses Google’s AI gave when asked for recommendations in this space.
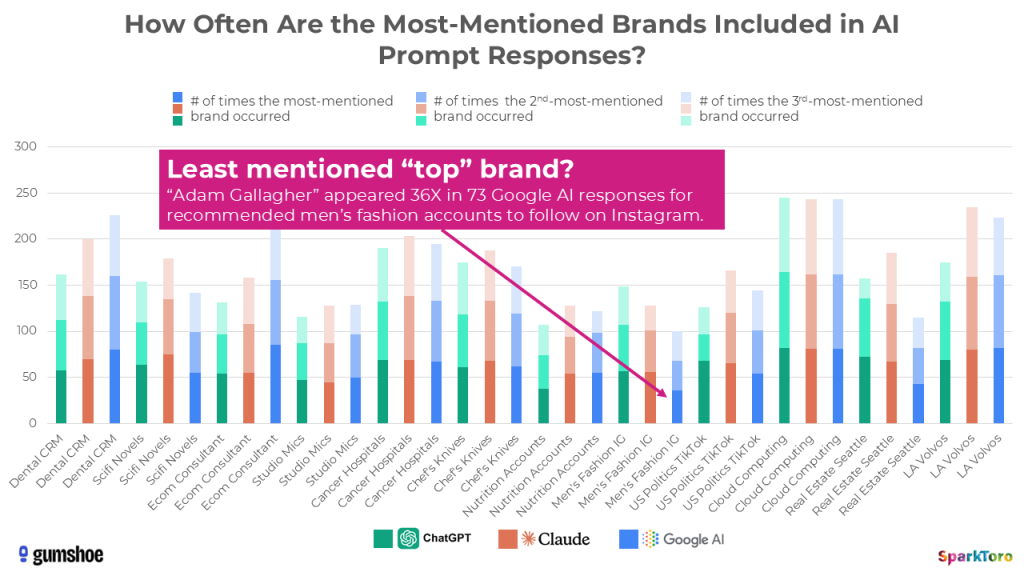
By running prompts over and over, you could reasonably get a sense of how diverse or homogeneous the AI’s consideration set is, and which recommendations are more/less likely to generally appear.
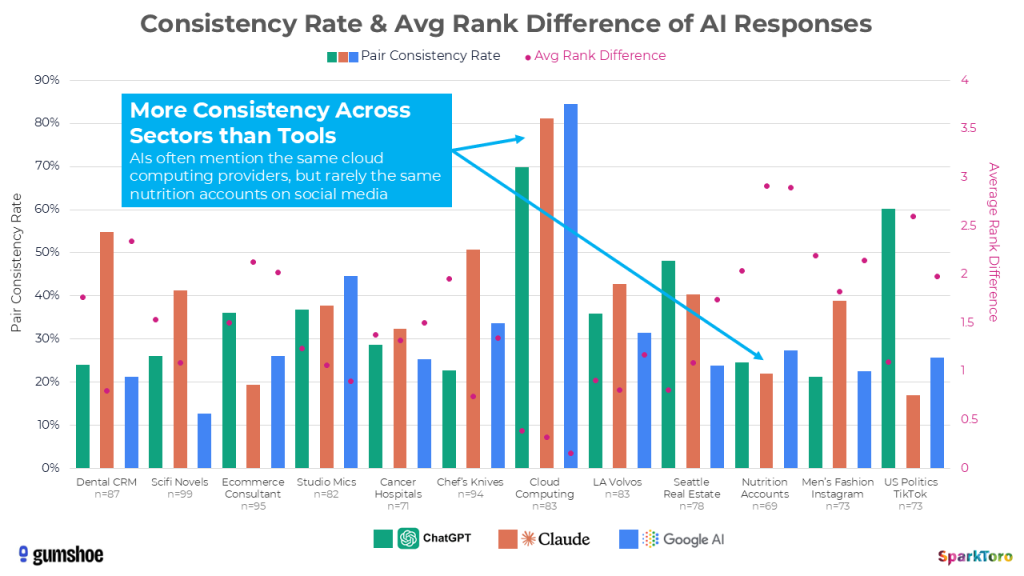
Further data suggests that how often a brand shows up in a topic-space may have much less to do with their relative prominence in that space, or even the model itself, and more to do with how many potential recommendations the AI is choosing from. There are only a few Cloud Computing providers for SaaS startups’ that AI tools considered, and thus the pairwise correlation (a measure of response similarity we took directly from the Carnegie Mellon researchers’ process) is relatively high, while the average rank difference is pretty low. That held true across ChatGPT, Claude, and Google AI.
Now look at the same bars and dots for recently-published SciFi novel recommendations. You’ll see low pairwise correlation and relatively high average rank difference (especially for Google AI). That sector’s much more of a wildcard than SaaS cloud computing providers because there are way more options for the AI tools to choose from.
Let’s briefly return to that example of West Coast cancer care hospitals. In ChatGPT’s results, City of Hope hospital in Los Angeles showed up in 69/71 answers: a 97% visibility rate.
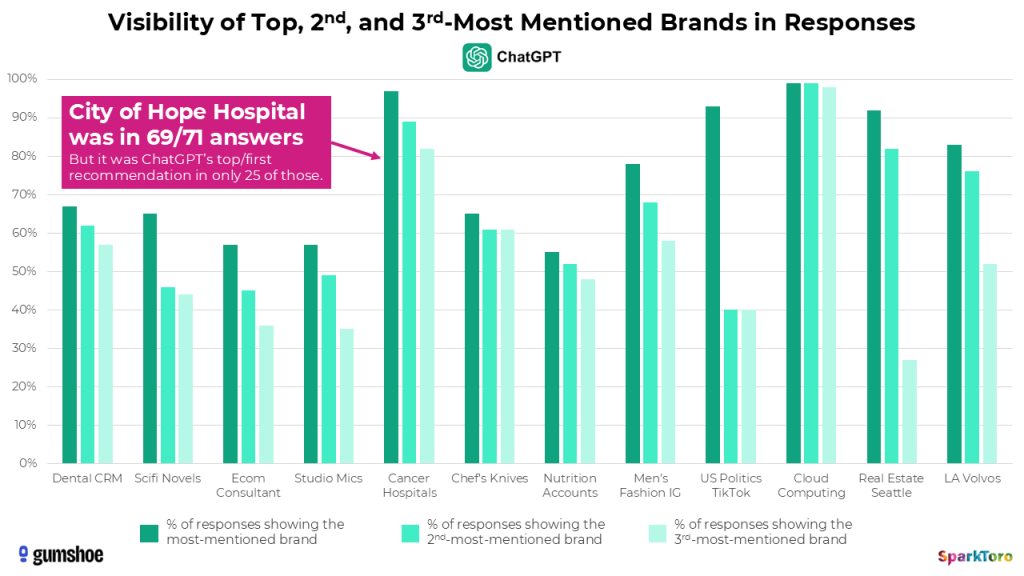
And yet, in the “rankings” of which hospitals ChatGPT showed, it was only the top mention in 25 responses. Is it the actual “best” cancer care hospital on the West Coast? Would any reasonable person know to ask ChatGPT the same question 100X to get this answer? What does the consistently high visibility and inconsistently placed ranking in responses mean?
Honestly, other than telling us more about how ChatGPT’s model works, and more specifically the prominence City of Hope has in their corpus, I’m not sure it means anything. I’m less likely to trust ChatGPT’s, Google AI’s, or Claude’s “list of answers” than I was before this research, and much less likely to intuit any meaning from the ranking position in an answer.
My takeaway on trustworthiness is that if you really want to know an AI’s set of recommendations, you need to ask over and over again; usually at least 60-100X, then average these out, then maybe look through traditional search results for anything new, then compare against other data sources for brands/products that no longer exist (in the course of this project, the AI tools recommended a good number of inactive social influencers, no-longer-in-existence TikTok accounts, and defunct Seattle luxury real estate offices).
But, at least when it comes to measuring visibility, there seems to be some statistical validity to the practice.
I hadn’t seen Gumshoe’s product in action before completing 95% of this research work, so when Patrick showed me their interface, this distribution of visibility numbers was a pleasantly aligned-with-the-findings surprise:
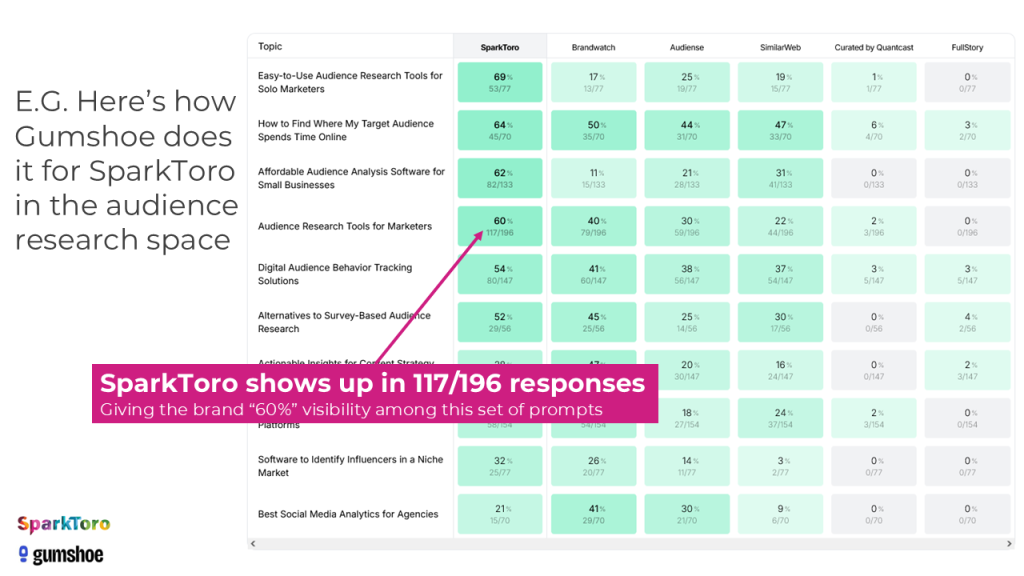
Their system created a set of synthetic prompts (i.e. ones an AI came up with) and ran these against all the major AI models, then produced this heatmap showing where we’re more and less visible vs. others in the AI tools’ consideration sets. Patrick’s even made this project in Gumshoe public for everyone so you can go play with the reports yourself.
WAIT! Are synthetic prompts a reasonable proxy for what real people type into AI tools? And how diverse are the prompts people use?
And, also, what does that real-human-created prompt diversity means for the trackability of brands in AI responses?
If you’re asking these questions, bravo. You’re way ahead of the thousands of companies throwing millions at the AI tracking tools. Because this, my friends, is a huge problem. Even if visibility % is a reasonable metric, and even if it’s possible to calculate that with statistical significance a math major would find convincing, there’s still a giant hole in AI tracking: the prompts.
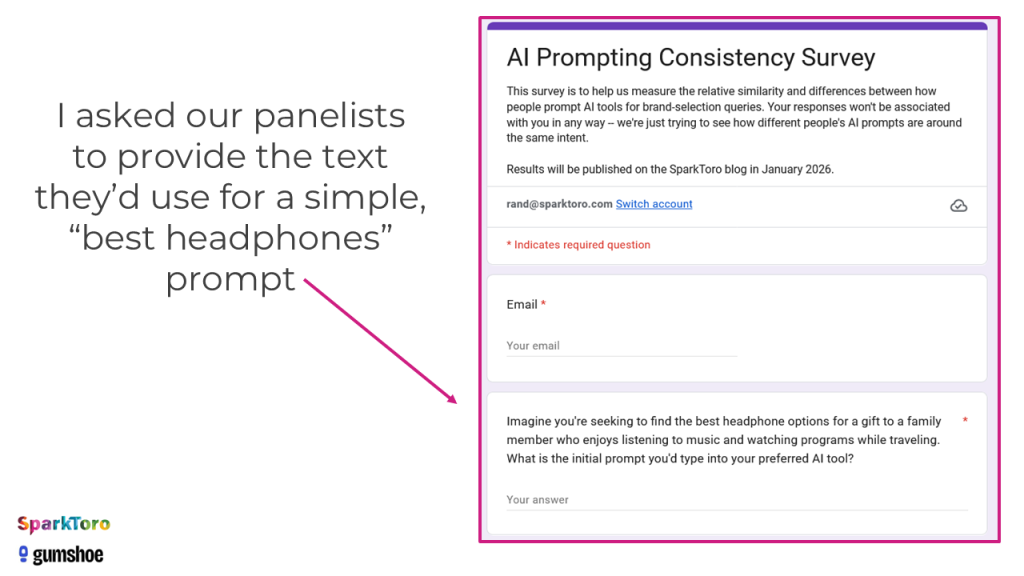
So, I went back to my survey volunteers and asked, yet again, for their help.
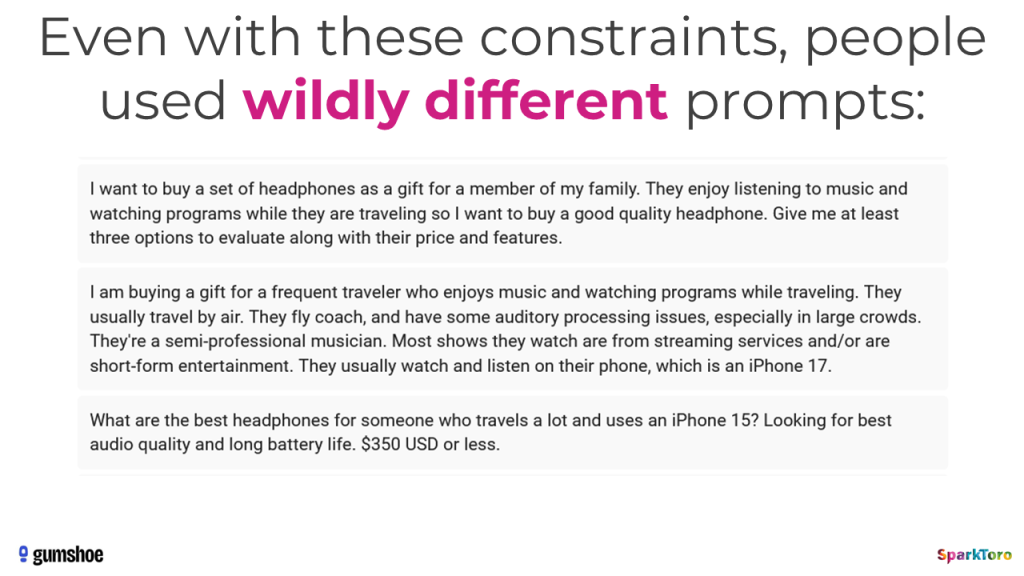
Across 142 responses, there were barely two prompts that, if you squinted, looked similar to me at all. This taught me that AI prompting is nothing like searching Google. People don’t reduce their search intent to the fewest, most logical set of 2-5 keywords, they get creative, and weird, and highly specific.
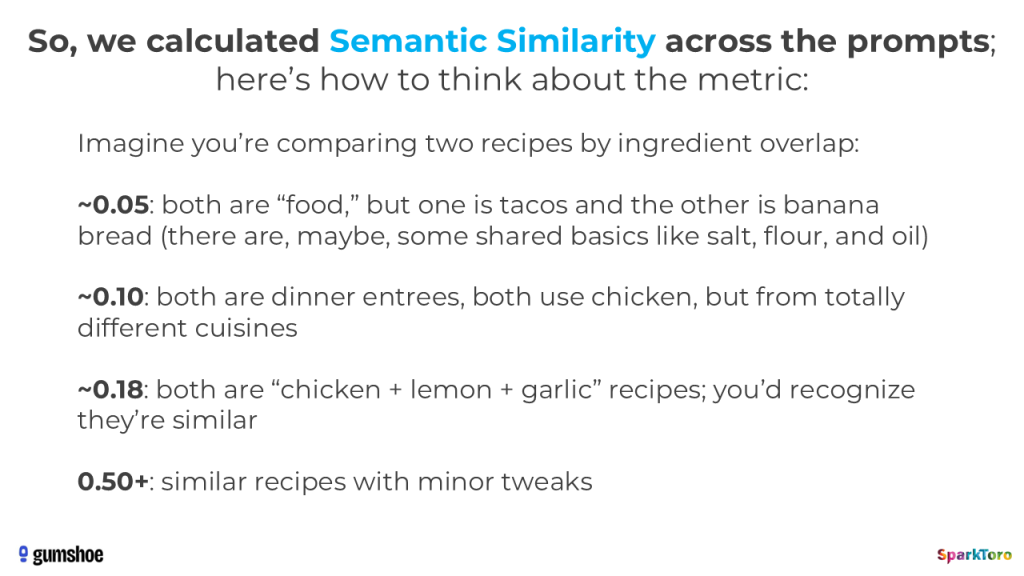
In order to proceed, we needed to put metrics (which I’ve tried to make more relatable above) against the dramatic diversity of prompts our survey takers crafted. Once again, we leaned on the Carnegie Mellon methodology and calculated semantic similarity on each pair of prompts, which I’ve visualized below:
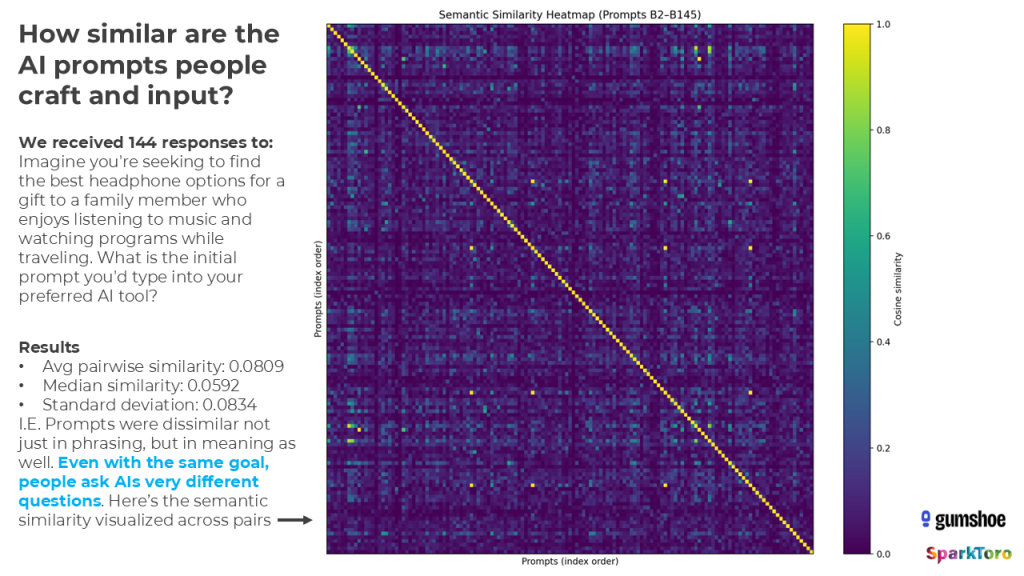
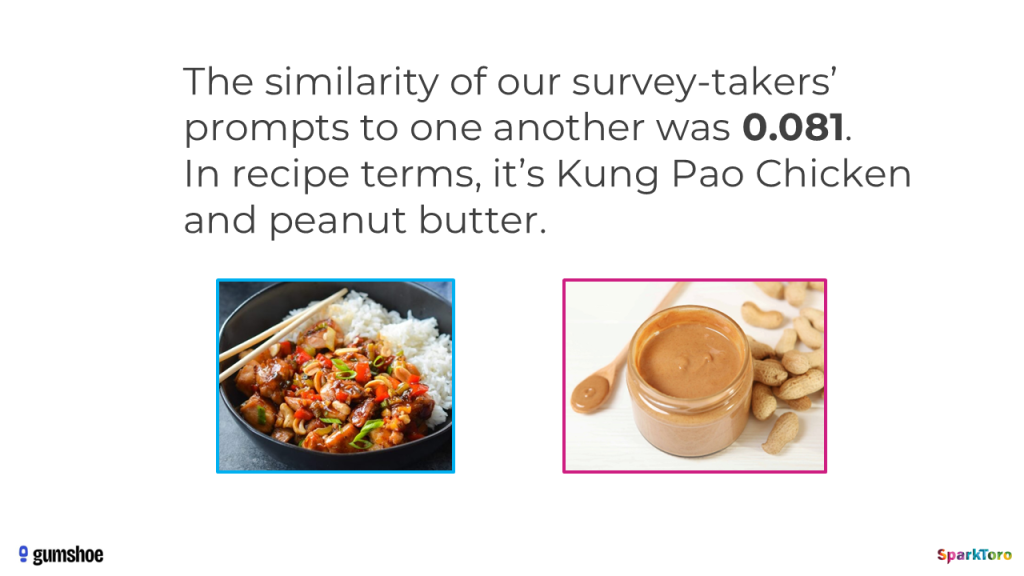
Overall, semantic similarity of these prompts was 0.081. Or, in the language of recipes, it’s like the average pair of prompts were Kung Pao Chicken and Peanut Butter — key ingredients had overlap, but other than being foods with peanuts in them, they’re not especially close.
OK, so AI tracking is busted, right? It’s a boondoggle after all. Rand’s original hypothesis was right. No need to track anything, since it’s all fake guesswork, eh?
Well, not so fast.
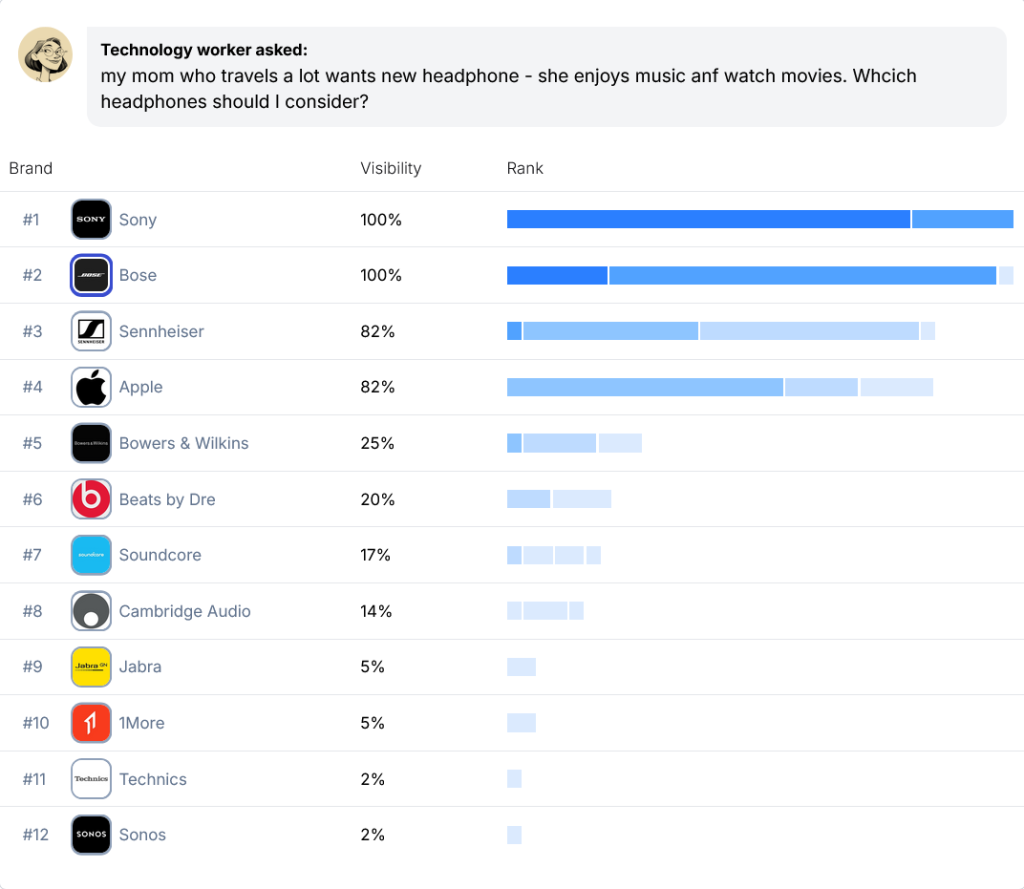
Before we completely rule out the reasonableness of AI visibility as a metric, we need to see if those highly varied, human-created AI prompts produce lists of brands in the AI tool responses that are way off of what we’d see in a synthetic set or in the initial sets of arbitrary prompts everyone used. This would be the final test: if all those Kung Pao Chicken and Peanut Butter prompts (which are actually about which headphones to buy for a family member) produced repeatedly similar results, AI visibility tracking might not be entirely snake oil.
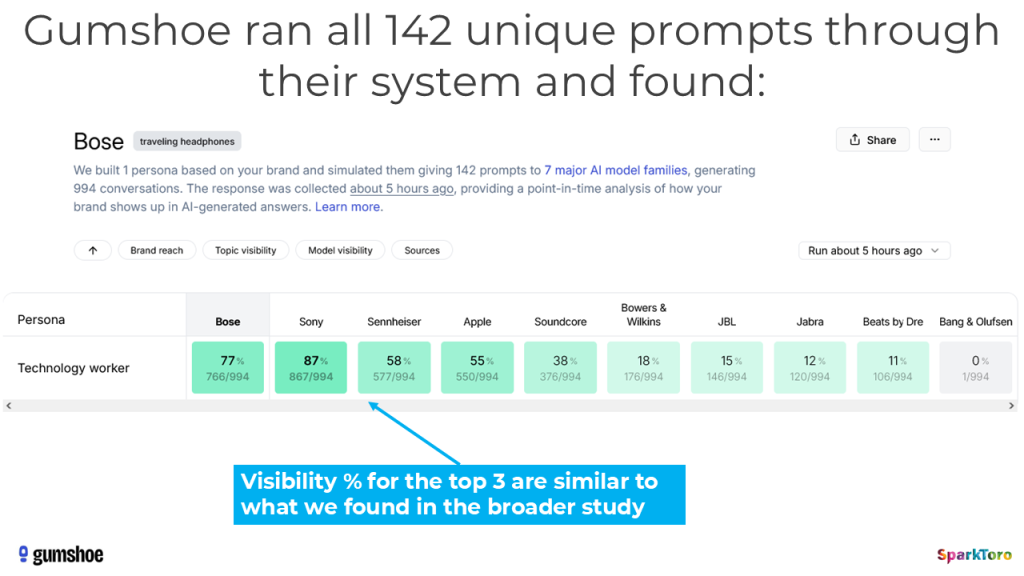
Running 142 human-crafted prompts about choosing the best headphones for a traveling family member multiple times resulted in nearly a thousand responses: 994 to be precise. And across those 994 AI responses, headphones like Bose, Sony, Sennheiser, and Apple showed up 55-77% of the time; remarkably similar to what we saw with top 3 brands in the tighter spaces from our survey-takers’ results in topics like L.A. Volvo dealerships, cloud computing providers for SaaS startups, and cancer care hospitals on the West Coast.
Just to be sure this wasn’t a fluke of a tiny brand space, I asked AIs for recommendations on other types of headphones: ones for gaming, podcasting, noise suppression, and more, and got very different answers. Those wildly different lists told me that despite all the unique ways people wrote their prompts, and the low semantic similarity scores in the text analyses, the AI tools had captured the core, underlying intent across those 142 prompts and returned answers from a relatively consistent set of brands, no larger or stranger than those from the broader study across a dozen other prompts.
We’re almost done, but there was one last experiment to try — a B2B prompt in a super-wide space (similar to SciFi novels) — that could show us whether unique, human-crafted prompts in a broad sector would provide the expected, broader range of answers. So, we asked panelists to input a prompt seeking brand design agencies for their friend’s coffee shop.
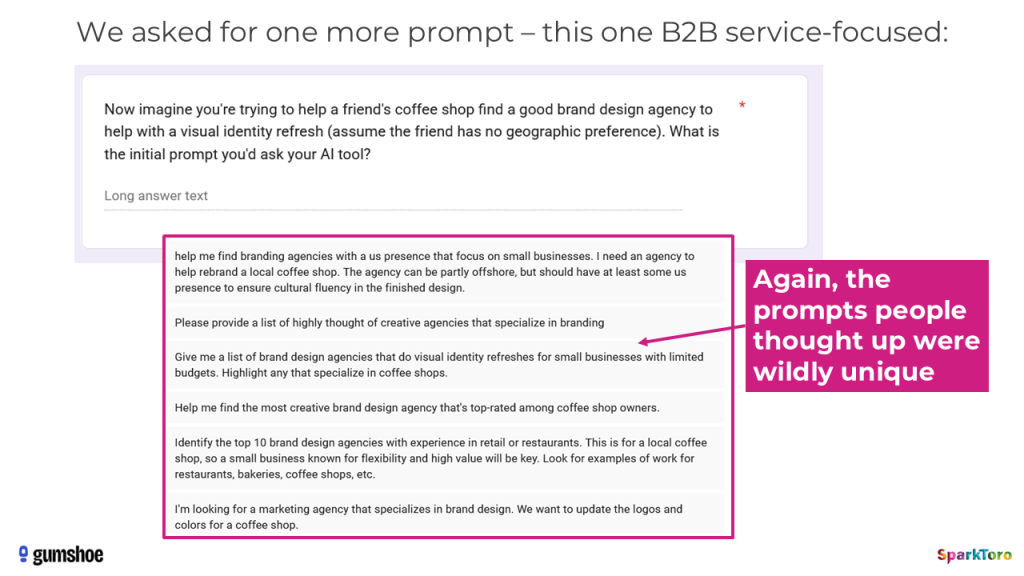
Once again, the results were massively unique — similar rates of semantic similarity (or lack thereof). And, once again, we see exactly the expected results when Gumshoe sent those prompts to the AI tools:
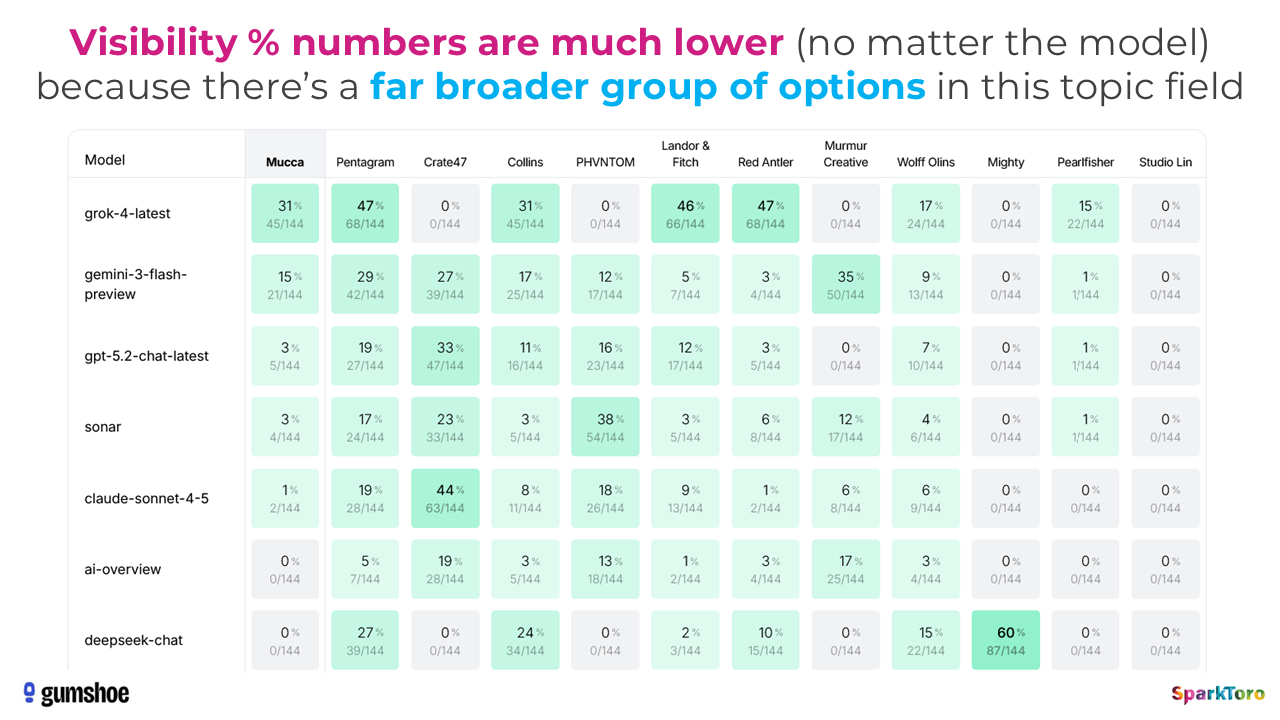
When Gumshoe ran their analysis showing the visibility percentages and rankings for the headphones prompts, the top brands often had 90-100% visibility, while the brand design agencies prompt produced high numbers in the 30%s-40%s. Note that they also make far prettier, easier-to-read charts to synthesize this data than I did above (apologies, I ran out of time to do more sophisticated data visualization).
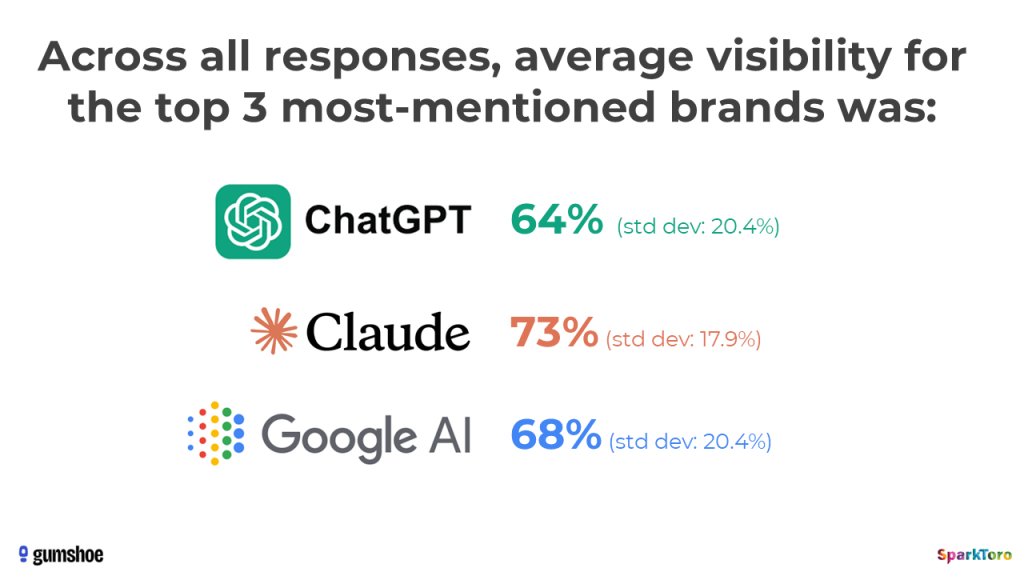
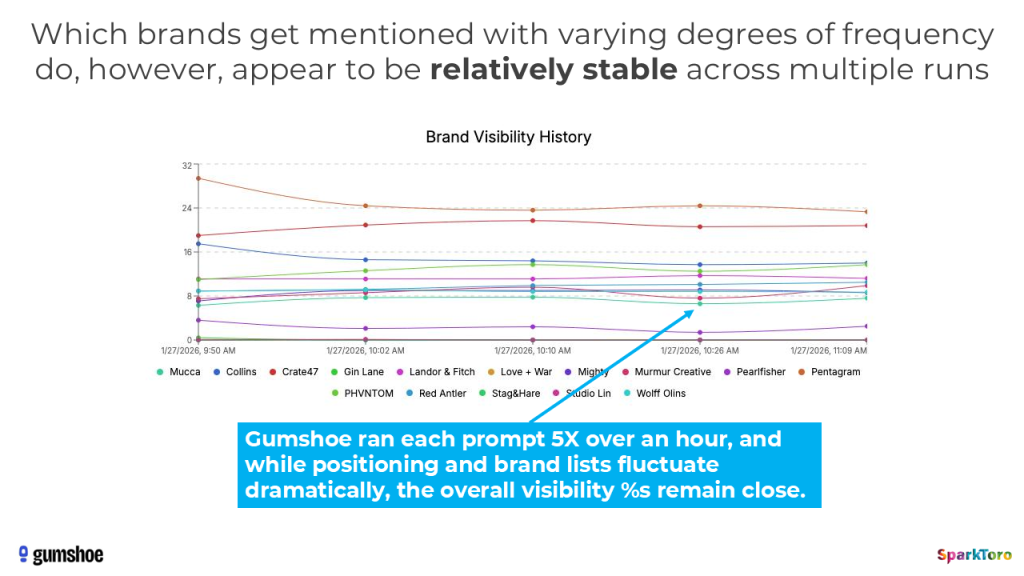
All of this reinforces the notion that visibility percent, across loads of prompts, whether written by humans or generated synthetically, are likely to be decent proxies for how brands actually show up in real AI answers.
I continued to grill Patrick about methodology, but even one of my assumptions (that the AI tool APIs might cache results and show less variation than they do to human tool users on the web) has some early data suggesting it may not be the insurmountable problem I presumed:
Now, in fairness, we didn’t research this question exhaustively or with the fortitude we put against other problems in this research, so it remains an open issue. And it’s not alone. AI tracking tools (or independent researchers) need to pick up where we left off. We need far larger sample sizes, thousands more prompts, bigger user panels, and more sophisticated stats professionals to run analyses like this and answer questions like:
- How many times do you need to run a prompt to have statistically sound answers about a brand’s relative visibility?
- Do API calls mimic the variety real users are getting with manually-inputted prompts? How closely? What are the differences?
- What variety of prompts are needed to get statistically meaningful answers about a sector/intent? How many are needed and does that number change based on the sector?
But, in spite of these shortcomings and open questions, I’m proud of our work.
We haven’t given absolute, definitive proof that AI visibility % is the best, most useful metric, but we’ve removed a healthy amount of my skepticism around the practice, largely disproven half the hypothesis, and validated the other half by illustrating how foolhardy it is to track “ranking position” in AI tools.
Research Conclusions
More data is needed. More people should look into these questions. And anyone who’s selling AI tracking should be ashamed of themselves if they don’t publish transparent, public, reviewable reports on this stuff. If Patrick and I can do it in our spare time while running multiple companies, you know who else can do it? Venture-backed behemoths with supposedly-huge data science teams.
OK, on to the summary of our findings:
- AIs rarely give the same list of brands or recommendations twice (<1 in 100 times, no matter the question)
- AIs almost never give the same list of brands/recs in the same order, even in spaces with limited options like LA Volvo dealers or SaaS Cloud Computing Providers (<1 in 1,000 times, no matter the question)
- These tools are probability engines: they’re designed to generate unique answers every time. Thinking of them as sources of truth or consistency is provably nonsensical.
- Users almost never craft similar prompts, even when they have the same intent. The variation of brands/recs in AI answers around a space in the messy wilds of AI prompting is likely much higher than what our controlled experiments revealed here.
- Measuring your brand’s presence in AI answers with precision is a fool’s errand. You can, with enough prompts run enough times, get a dartboard-pattern-like answer comparing you with others. I’ve been swayed from my initial position and now believe visibility % across dozens to hundreds of prompts run multiple times is a reasonable metric.
- But, any tool that gives a “ranking position in AI” is full of baloney.
If you do nothing else after reading this report, please, please, marketers, analysts, and execs: stop throwing money at AI tracking products that don’t provide stats-backed, publicly-reviewable research. Before you spend a dime tracking AI visibility, make sure your provider answers the questions we’ve surfaced here and shows their math.
A huge thanks to Patrick O’Donnell from Gumshoe (for being my partner on this research), Kristy Morrison (for data normalization and research review), and Lindsay Perkin, Cyrus Shepard, Darren Shaw, and Amanda Natividad (for reviewing a draft version of this research).
Methodology Details
Last, but not least, some FAQs on our methodology:
- Are you qualified to do this research? Was it peer-reviewed by the scientific community? Why should I trust your results?
I always love these questions, because the insinuation is simultaneously: “I don’t believe your results and am also unwilling to do any work to validate or disprove them.” No, I/we aren’t professional researchers or credentialed data scientists. I’ve published dozens of previous research pieces in the field of digital marketing, been cited by the U.S. Congress, Dept. of Justice, and hundreds of notable media publications, but that doesn’t make me a professional. And I *really* hope more credentialed researchers will be inspired by our design and publication to undertake a more significant, science-journal-publication-quality work on this topic. But if your skepticism is immense or you perceive that our process was overly flawed, please repeat these experiments and publish your work — I’ll even link to it from here and retract bad takes/point out flaws in our work. - Did we put constraints on the survey takers’ AI tool methodologies in any way?
No. Other than requesting that everyone use the same model and prompt, there was no request to, for example, manually adjust ChatGPT’s temperature setting, or ensure that everyone was in the same country, or used their desktop vs. mobile device, had history turned on/off — we wanted to know the normal amount of variety that would be seen from users in the real world, so we asked everyone to simply use their default experience with these tools. Some were longtime users with loads of history and custom setting, others were first time users of the AI product we asked them to query. As a result, we believe we’re showing a distribution of responses that one could expect if a distribution of “normal” people used these AI tools in their myriad of everyday ways. - Can you show us the full prompts and raw data?
Yes. In fact, we’d love if you did. Patrick has painstakingly created an AI consistency experiment results mini-site where you can browse through each prompt, response, and metric to your heart’s content. Fair warning it’s not hosted on a giant instance, so may be slow to load. - Did we change the temperature settings in AI tools in an attempt to reduce disparity?
No. We asked everyone who ran the reports to keep their usual settings (whether those were personalized or default), and Gumshoe uses non-modified (i.e. vanilla) API calls to the AI services when requesting their data. - Did we control for variance through timeboxing the survey takers’ prompts and responses?
Somewhat. Each survey request ran for approximately seven days, then was closed. These requests took place over November and December 2025, so newer/updated models may have more or less difference than what we found over that timeframe.
A final request: please share this research with people in your organization, agency, or industry group who need to see it. Everyone in and around the world of AI tracking and brand measurement needs to know this stuff.