In late November/early December of 2015, I ran a survey of consultants and agencies asking deep questions about their structure, fees, employees, projects, and more. Thanks to responses from over 400 folks around the world, I’m able to share what I hope will be some of the most useful data from that project.
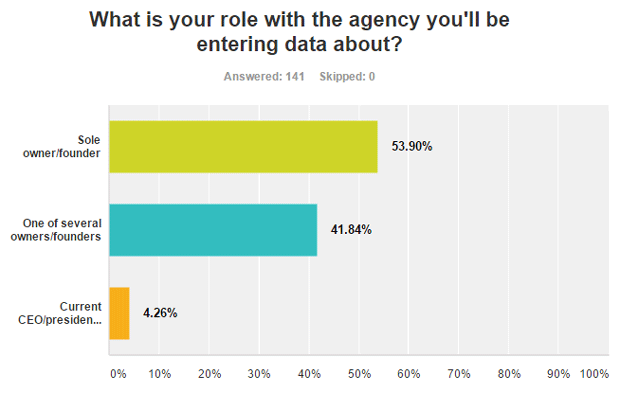
 Survey takers were primarily founders, owners, and presidents/CEOs of consultancies & agencies
To start, some brief disclaimers:
- All of the participants of the survey have been anonymized, and any segments that had fewer than 10 participants have been removed to maintain that protection. Thus, some countries with only a few agencies/consultants filling out the survey (like South Africa, Japan, Russia, and India) have been removed from this dataset. Hopefully in the future I’ll get heavier feedback from those regions and can update this project.
- Because much of the data averages and ranges were similar, I’ve grouped the United States and Canada together, and I’ve also grouped participants from Western European countries (specifically Ireland, Germany, France, The Netherlands, Spain, Portugal, Switzerland, Italy, Sweden, Norway, and Denmark), the United Kingdom, and Australia together as a cohort due to the similarities in the averages of their responses (this latter set will need to wait for a second post, as I’m overwhelmed with other obligations).
- My final segmentation was between solo consultants (firms that had only a single full-time employee) and multi-person agencies (ranging from two-person groups all the way up to 500+ person agencies).
Below are links to the various data points I’ve extracted for each of the 2 groups:
- US & Canada Solo Consultancies
- Consultancy Descriptions
- Services Offered
- Business Age
- Part-Time & Contract Employee Numbers
- 2015 Revenue Ranges & Growth
- Self-Provided Benefits
- Non-Billable Work Activities
- Productivity Tracking
- Software & Tools
- Number of Paying Clients & Growth
- Pricing & Billing
- Sources of New Clients
- Proposals & Close Rates
- Service Guarantees & Renewal Rates
- Gross Margin
- Long-Term Goals
- US & Canada Multi-Person Agencies
- Agency Descriptions
- Services Offered
- Business Age
- # of Full/Part Time Employees
- 2015 Revenue Ranges & Growth
- Billable Employee Time
- Salary Ranges for Employees
- Employee Benefits & Perks
- Training Offered to Employee
- Productivity Tracking
- Average Employee Tenure
- Software & Tools
- # of Unique, Paying Clients & Growth
- Pricing & Billing
- Sources of New Clients
- Proposals & Close Rates
- Service Guarantees & Renewal Rates
- Gross Margin
- Long-Term Goals
Solo Consultants in the US & Canada
Consultancy Descriptions
Here’s a relative comparison of the words/phrases individual consultants used to describe their businesses:

Given that my audience if SEO-centric, it’s no surprise to see lots of consultants using SEO to describe their business. Full service is more surprising, particularly given we’re talking about one-person shops, although subcontracting and serving small businesses may play a role. in that.
Services Offered

Again, SEO dominates, followed closely by analytics, strategy, and content marketing+creation. Very few of the consultants in this survey had overlap with either PR or any forms of offline marketing (which makes sense).
Business Age

The distribution of founding ages is above, but I also ran some quick math to find that the average age was 4.07 years (assuming “2004 or earlier” as 12 years in age). What surprised me here was the dramatic number of new solo consultants in 2014 and 2015. It’s hard to know if that’s a trend and we’re going to see more new, independent consultants over the next few years, or if it’s simply that many solo consultants move on to other roles after 1-2 years. I also found the 2008 spike interesting – part of me wonders if that’s correlated with the financial crisis and the large number of layoffs that happened that year.
Part-Time & Contract Employee Numbers

The distribution here was somewhat unexpected for me. If I’d had to guess, I would have estimated that more than half of solo consultants don’t use any part-time or contract team members, but clearly that’s not the case (which may speak to how so many are able to offer full-service). I do feel a bit bad for the solo consultants who are managing 11-20 unique part-time or contract people! That’s a monstrous time commitment.
2015 Revenue Ranges & Growth

Most consultants are under $100,000 in billings, but it was impressive to see how many reported revenue in the $250K-$500K range. There was also one solo consultant claiming revenues of $2.5mm+, but I wonder if that might be gross revenue, and they pay out a substantive portion to buy ads or subcontractors on behalf of clients. Hopefully they’ve sorted out the taxes right…
I also asked the question comparing 2015 revenue to 2014:

A good majority said they’re making more in 2015 than in 2014, which is a great sign for the industry as a whole, and certainly for these consultants. That said, we may also be dealing with a biased sample set in that consultants who are making significantly less from years prior could have chosen alternate professional paths and left the field, keeping them out of this survey. It may be valuable in 2-3 years to repeat the survey to the same folks who took this one and see how many remain in business (and to ask about their reasons for leaving if/when they did).
Finally, for this section, I asked about salary ranges, which may give a more nuanced view for solo consultants vs. business revenue:

I’ve mashed up the chart and graph for this one to help show as much data as possible. You can see that many folks chose to skip this question, but a little more than half filled it out, giving us a reasonable sample range that lines up roughly with my anecdotal experiences in our field. Most of our respondents are clustered in the $35,000-$125,000 range.
Self-Provided Benefits

I’m glad to see most consultants give themselves the freedom to work from home/the road (although why that number isn’t 100%, I can’t say). I was also pleasantly surprised to see such a large percent giving themselves shortened work weeks. If your solo consulting gig isn’t flexible, why have it, right!?
The sadder bits are below in the benefits around paid medical and dental care. Hopefully those numbers are suggesting that significant others/spouses are covering those on behalf of the consultants, and not that they’re skipping healthcare.
Non-Billable Work Activities

For these answers, the “average number” column is the one we care about. Essentially, consultants are saying they spend roughly 11% of their non-billable hours, on average, creating content to help promote their work. Smaller percents are spent on the other activities (which make sense for solo consultants).
Productivity Tracking

Almost half of consultants are formally time-tracking their activities, which is impressive. Another third use project-tracking software (Trello and Basecamp were both mentioned in our software/tools responses below). Yet another third don’t do any of that, which I think can work fine for solo consultants if they don’t feel overwhelmed by their client obligations.
The one I was surprised about was the last answer, where only 2 participants said they ran client satisfaction surveys. I’d have thought that to be a more popular and important metric, even for solo consultants.
Software & Tools
Given the relatively light incomes of so many consultants, it was remarkable to see that most are spending thousands of dollars annually on paid tools and software.
In addition to asking about tool budget, I included a question about the most commonly used tools/software that people pay for. I’ve listed all the tools and software mentioned that had more than 3 people saying they used the paid version:
- Adobe Creative Cloud Suite (15 responses)
- SEMRush (14 responses)
- Moz Pro (14 responses)
- Screaming Frog (12 responses)
- Ahrefs (8 responses)
- Majestic (6 responses)
- Google Drive (5 responses)
- Buzzsumo (5 responses)
- Hootsuite (4 responses)
- MS Office (4 responses)
- Buffer (3 responses)
- Hubspot (3 responses)
- Dropbox (3 responses)
Remember that Moz is probably over-represented in this dataset, while its direct competitors are likely undercounted (given that I’m Moz’s founder and most of the survey takers probably follow my social media accounts).
Number of Paying Clients & Growth

The few folks who manage, by themselves, 76-100 active clients at a time was the only big outlier for me here. The rest of the distributions make sense.

The 26% of folks saying 0 clients in 2014 is almost certainly from consultants who weren’t yet in business that year. The rest of these line up well, though it’s interesting to see that a handful of consultants who served in the 51-75 range in 2014 pulled that number back in 2015.
Pricing & Billing

Most consultants, it would seem, use a variety of billing options (at least 2-3). The low number of folks who say they offer performance-based pricing fits with my experience, too. In my long-ago consulting days, we tried it a few times and had a couple successes and many false starts and regrettable jobs. I almost feel bad for the 3 consultants still trying to make it work.

Average billing amounts aren’t too surprising, though I did expect to see a few consultants who served only 1-2 clients at very high rates in the data and didn’t (though it’s possible those folks were among those who skipped this question).

I am a bit more intrigued by the quantity of folks offering no minimum terms. Client retention and contracts were, from my experience, a huge part of how successful, long-term consulting businesses were built, but apparently many folks today either don’t see it that way, or offer the flexibility to start without it.
Sources of New Clients

Pretty remarkable to see how many folks attribute their client leads to referrals. The four top client referrers in order are “existing clients,” “personal/non-client/agency,” “past clients,” and “other agencies/consultants.” I think that fourth one is incredibly cool – it speaks to the openness and sharing of our industry, and the willingness people have to refer clients even to direct competitors.
I’ll admit that the surprising one here for me was on the relatively low standing of conferences & events. In my consulting career, that was a major referral source, but perhaps events are less strong sources now than in the past, or perhaps many of these consultants are attendees rather than speakers (I only ever landed one client as an attendee, the rest came through speaking at events).
Proposals & Close Rates

I crunched the 41 responses and came up with an average of 31.9%. The answers were somewhat bifurcated, with many responses of “0” (9 in fact) and several in the 75-100 range (7 of these).

For conversion rate, our average was higher – 58%. It was bizarre to see two scores of “0” and three of “100…” Hopefully those at the top of the scale will be a bit more aggressive and those at the bottom will have better luck in 2016.
Service Guarantees & Renewal Rates

I was very glad to see the answers to this one are so often simply a straight “no.” IMO, it’s relatively irresponsible (and non-transparent) to guarantee rankings, since these simply aren’t within a consultant’s control (no matter how talented you may be). Hopefully, the folks who do offer them do so with the full knowledge (and with their client’s full knowledge) that SEO is not a guarantee-able process, especially rankings.

The average here was impressively high — 73.9%. My memory was that Moz’s rates floated in that range only after we’d been established for some years and had lots of solid processes in place. Kudos to today’s consultants who are achieving those rates.
Gross Margin

Only 14 of the 41 folks who answered this question put a number other than “0,” suggesting that very few of them calculate or know their gross margins. It’s definitely more important for businesses with employees and who have larger scale, but I’d still strongly encourage a independent consultant to know their number! It can help with planning, with client strategy, with understanding strengths/weaknesses in your business model, and with selling your consultancy, if you ever choose to do so.
The average for the 14 who did answer was a healthy 60%, higher than most consulting businesses, where the general average is expected to be in the 30-40% range.
Long-Term Goals

This is one of my favorite questions in the survey because I’m always interested to understand how founders think about the businesses they run. I didn’t honestly expect such an overwhelming number to give the top answer – that they plan to continue to run/operate the consultancy themselves for the long term – but I’m glad to see it. Solo consultancies are notoriously challenging businesses to sell, and so this healthy does of realism is probably a good sign.
Multi-Person Agencies in the US & Canada
Agency Descriptions
For the solo consultants, the data obviously came from the consultants themselves, but I thought it was important for the multi-person agencies to show where data originated.

American and Canadian agencies, like their solo consultant counterparts, were likely to use words like “full service digital” and “SEO” in their descriptions. It was interesting to also see the popularity of “content marketing” and “inbound marketing” for a good number of these folks.
Services Offered

SEO still led the pack, but analytics, content, and social media weren’t far behind. A surprisingly high percent (at least, vs. my expectations) also offers web design & development, though I don’t know what percent subcontract that work vs. do it in-house.
Business Age

The average age of agencies was considerably older than that of solo consultants at 6.84 years. This is actually a conservative estimate, since so many agencies started before 2004, but since I don’t have their precise start year, I’m forced to use the age of 12 years old. This is more than 2.5 years older than the average solo consulting business (at 4.07 years).
# of Full/Part Time Employees

Nearly half the agencies only have a small group of employees (2-5), and a very limited number were over 50 people. Thus, we’re looking mostly at small and mid-size agencies in our data analysis, which is important to keep in mind for the remainder of the answers.

Similarly, most of the agencies in this survey had only a few part-time or contract employees, and a very limited number used more than 20 in a given year.
2015 Revenue Ranges & Growth

Revenue ranges made sense, and generally scaled with company size. If I have bandwidth in the near future, I’ll try to do a more sophisticated analysis of how revenue scales vs. size among the agencies in the survey. It would be interesting to know, for example, what the average and ranges for revenue/employee are.
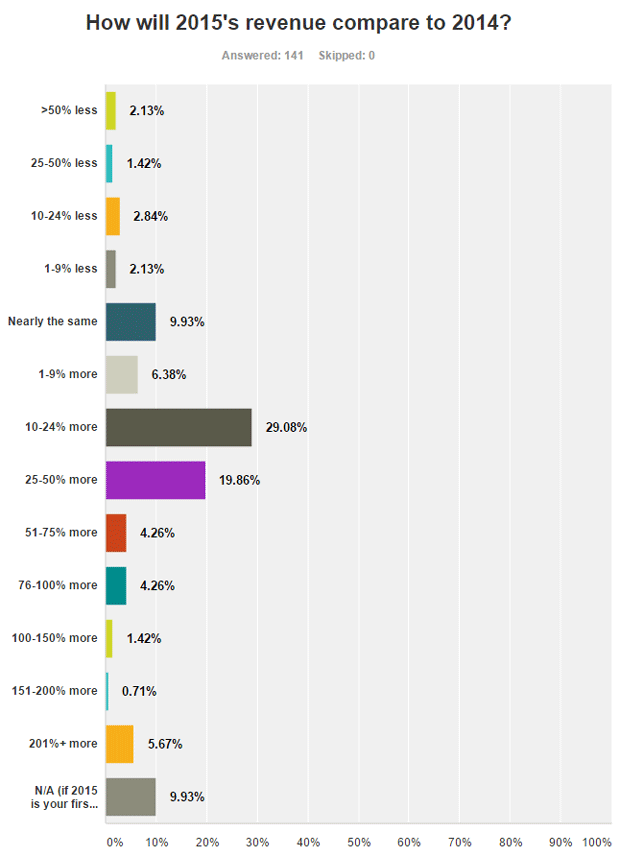
The overwhelming majority of our agencies reported significant revenue growth from 2014 to 2015, even more so than solo consultants. Apparently, it’s a great time to be digital marketing agency.
Billable Employee Time

Salary Ranges for Employees

The color-coded chart above shows the distribution of salary ranges across positions as reported by the agencies. Perhaps not surprisingly, web developers and senior consultants tended to be the highest paid (apart from senior execs and owners). Overall, compensation at agencies is considerably lower than in the in-house world (at least for the positions I’ve been exposed to), though that could be selection bias based on my view into, primarily, the tech startup world in high-cost-of-living cities like Seattle, the Bay Area, and New York.

I also provided the more detailed chart (above) to get more granular into the data of salary ranges. In general, it appears that salaries aren’t too dissimilar to solo consultants. Entry-level is a bit lower, mid-level is nearly the same, and senior consultants are somewhat above what the solo consultants gave as their distribution of earnings.
Employee Benefits & Perks

Stock – options or grants – were the one that initially surprised me most about this data until I saw the high number of agencies that offer profit sharing (which in many ways serves a similar function, and may even be preferable for employees depending on how its done).
I was also deeply saddened to see the small number of agencies – only 18.75% – that offer parental leave policies beyond the law’s requirement (which, in the United States, is literally the worst in the developed world by a mile). And it was surprising to see that less than half of agencies offer paid medical/dental/vision care, although at least, it is now possible for employees to acquire their own healthcare vs. a decade ago.
NOTE: 9 of the 141 agencies in this dataset are based in Canada, where parental leave and healthcare laws are considerably different (and generally much more worker-friendly) than the United States.

Agencies were more generous when it came to other types of perks, including bonuses for client referrals, performance-based bonuses, and more. I’m particularly passionate about the transparent path to promotions and raises, and it heartened me to see that almost half of the respondents to the question offered it.
Training Offered to Employees
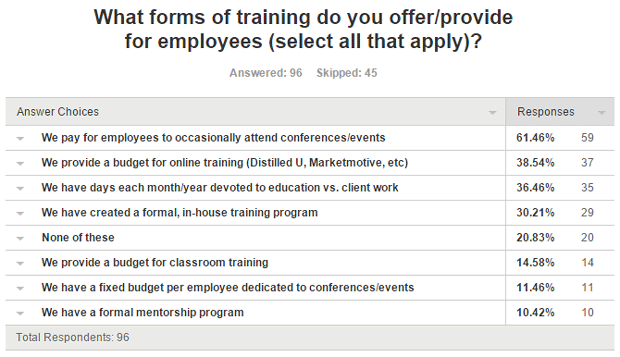
Only 20% of agencies said they offer “none of these” options, while most had at least 1 or 2. It was surprising that there isn’t more of a bias toward one activity over others (occasional conferences being the only exception). I was expecting more to have in-house programs or online education or classroom offerings, but I think this speaks to how self-taught and informal the worlds of digital marketing and SEO in particular still are.
Billable Time & Productivity Tracking

The “Average Number” field is the one to look at here, although it appears an errant entries biased the first field to have a very peculiar number (one taker put in a value of 15,000). If we remove that single entry, the average for “engage in social events for staff/team members” drops to a much more reasonable value of “6.”
As far as the list goes, it’s no surprise that meetings are the biggest non-billable-hours time consumers in agencies, and that content creation closely follows.

Agencies are much more likely that their solo consultant peers to track time formally, either with software, or internal performance tracking. Client surveys were also considerably more popular (though still surprisingly low, IMO).
Average Employee Tenure
Tenure ranges dramatically (as the chart below shows), but it’s something many agencies feel discomfort and concern about (because high turnover and training costs are such a major issue in the field).

In addition to the above, I asked the question “What percent of your employees who started in calendar year 2013 are still with the agency today?” That answer’s average (from 81 respondents) was 60.64% (meaning ~60% of employees agencies had hired 2-3 years ago were still with them as of the time they took the survey).
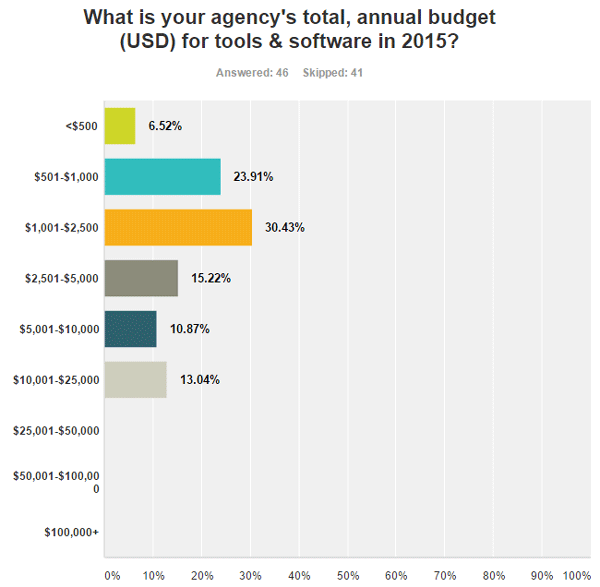
Software & Tools

This question’s responses impressed me – agencies, even small ones, are spending thousands of dollars per year, and sometimes many tens of thousands, to make their teams more effective and efficient. This is one of those charts I wish I could have seen years ago. I’d always predicted that agencies and marketers would spend less on all-in-one solutions, when in fact the clear trend has been willingness to spend more on tools and software in order to get the best-in-class product for each niche or function.

I also asked an open-ended question about which tools agencies paid for and used most. The tools with more than 3 unique mentions are listed, in order, below:
- Moz – 49 mentions (although, since I ran this survey, this number is almost certainly biased)
- SEMRush – 24 mentions
- Basecamp – 16 mentions
- Screaming Frog – 15 mentions
- Adobe Creative Suite – 13 mentions
- Ahrefs – 11 mentions
- Majestic – 8 mentions
- Hootsuite – 8 mentions
- MS Office (including Excel) – 8 mentions
- Google Apps for Business – 8 mentions
- Raven Tools – 6 mentions
- Hubspot – 6 mentions
- Buzzsumo – 5 mentions
- Slack – 5 mentions
- Mailchimp – 5 mentions
- Moz Local – 5 mentions
- Buzzstream – 4 mentions
- Yext – 4 mentions
- Authority Labs – 4 mentions
- Sprout Social – 3 mentions
- Deepcrawl – 3 mentions
- Wordstream – 3 mentions
- RivalIQ – 3 mentions
- AWR Cloud – 3 mentions
- STAT – 3 mentions
- Conductor – 3 mentions
- Unbounce – 3 mentions
My biggest surprise? That OnPage.org, KeywordTool.io, and Search Metrics didn’t have stronger showings. That said, I suspect if I’d listed out tools and asked whether agencies used/paid for them, I would have had far more “yes” responses. This is more a set of open-ended, top-of-mind tools, and since it’s the agency owner/CEO filling this out, it’s very possible that more tactical tools used by the practitioners went less mentioned.
# of Unique, Paying Clients & Growth

I asked two questions here — one about current number of clients and another about number of clients in the prior year (2014).
The big surprise was how each bucket (for 2015) was nearly the same in size. Number of clients served is, apparently, not dependent on the size of the agency. Some small agencies had loads of clients and some larger firms had only a few. Also surprising was the fact that, in 2015, no one had more than 150 clients, while a handful in 2014 did. I think that’s probably a positive trend; it’s hard for any size agency to effectively serve that many folks, and hopefully portends more effort on fewer, higher quality clients (note that some of the other, smaller buckets also rose in percent size vs. 2014).
Pricing & Billing

This one went much as expected, with the exception of the almost-15% of agencies that still offer performance-based contracts (which, IMO, are crazy, but if it works for you, my hat is tipped and I wish you the best).
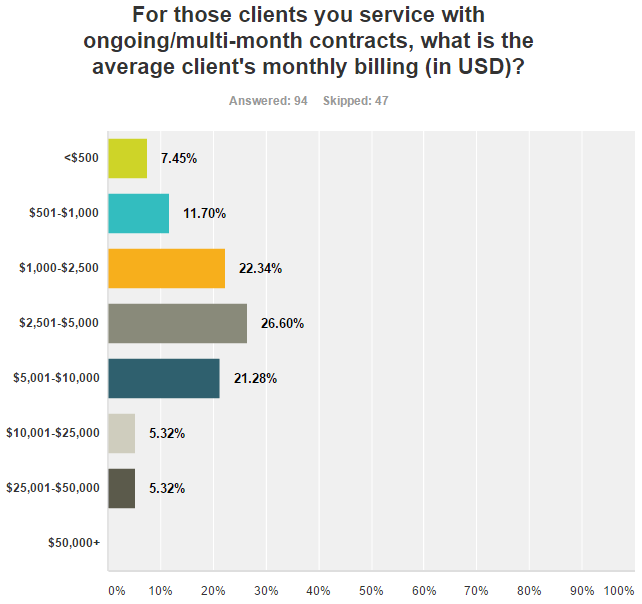
Average monthly billing wasn’t terribly surprising, either, though the small number of folks above $10K/month struck me as slightly odd. For most companies with revenue in the $10mm+ range (medium, large, and enterprise businesses), I’d have expected larger retainer prices. I think a lot of web marketing agencies are undervaluing their work, or perhaps competition is getting more cutthroat. Back when SEOmoz was an agency (2005-2009), we were generally charging in that $10-$25K/month bucket, and were by no means the most expensive group on the market.

The last question I asked around pricing had to do with minimum terms. More than half of agencies do have minimum contract terms, but honestly, I’d have expected more like 75%+ given how crucial it is to have recurring, predictable revenue in a services-based business.
Sources of New Clients

I think this might be one of the most interesting and valuable responses for those seeking to break into the agency world or scale up their growth. It’s cool to see how powerful SEO and content marketing are for attracting clients — speaks to the value of the services these agencies provide as a group, too 🙂
The one I thought would be higher is the directories, given how well those types of content pieces rank for queries like “Best SEO Companies” and the like. In many ways, I’m glad to see it down lower as my perception of lists like TopSEOs and their ilk is not positive. I’ve tried for years to maintain my own Recommended List, but it’s a serious challenge to balance inclusivity, quality, vetting, and timeliness.
Proposals & Close Rates
I started this section asking:
What percent of client proposals/bids/new business would you estimate are contested (i.e. you’re one of several agencies/consultants being considered for the project)?
The answer across 94 respondents was 44.23%.
Next I wanted to know:
On average, what percent of client proposals/bids/new business would you estimate your agency converts from lead to sale?
That answer, across 94 respondents, was a similar 47.84%.
If you’re beating 50% on either of these (or both), you’re ahead of the curve.
Service Guarantees & Renewal Rates

I included the answer choices matrix below to illustrate the full text of the choices.
My hope here was that even fewer folks were offering guarantees, but I am glad to see how few do so based on rankings, which is the only one I find truly questionable (something our industry has discussed in detail for more than a decade). ROI targets, sales targets, and traffic targets all feel more realistic and appropriate, though given the need for client participation, it still wouldn’t be something I’d bias toward if I were still in the consulting world.
Next, I asked about renewals:
In your estimate, what percent of clients that you actively work to keep (i.e. not those whom the agency “fires”) end up renewing their service/re-upping a contract?
The average, across 94 respondents, was 78.18%, which I found impressively high.
Gross Margin
Most service-based businesses range from 10-40% margins. Anything over 50% is considered exceptional (vs. the software/product world, where margins are often 60-80%).
I asked the survey takers:
What was your organization’s gross margin percentage (revenues – costs, not including taxes/etc) in 2014? If you don’t know, enter 0
55 respondents answered with an average of 32.5%, a very respectable number. Fascinatingly, there were 4 responses north of 70%, which is just remarkable for a multi-person agency. Congrats to them!

This is one I probably shouldn’t have included in the survey (too detailed, too hard to predict, and too in-the-weeds). Nonetheless, I received 87 answers, and the distribution suggests most owners expected their agencies to provide better margins in 2015 than 2014.
Long-Term Goals

The last question was about long-term goals. I expected more agency owners to say “sell” but apparently, almost 3/4s said they plan to continue to operate themselves or turn over to partners/a new leader. This is probably more realistic, since agencies are tough entities to sell in our space, and was, in many ways, refreshing to see.
Thanks so much for checking out this resource. I hope, in the future, to re-run the results, likely with a more limited and easier-to-complete set of questions, as this turned into a huge task for survey takers (and for me).
A huge thank you, as well, to the participants of this survey, without whom, this data could not exist.