It’s time for part three (of five) in our ongoing analysis of the 2020 US elections. If you haven’t already, check out part one, covering identity & common enemies, and part two on positioning & segmentation. Today, we’ll get into the weeds of survey methodology, why election polling appears to be less accurate, and how your market research might suffer if you follow that same path. Then, we’ll shift gears and look at a choice every marketer faces: convincing your competitors’ customers to try you, or ignoring competition and growing your own fans.
Quick caveat reminders:
- We’re analyzing the election each night this week, because its size and impact are immensely relevant for marketing, market research, and audience understanding.
- This series attempts to be non-partisan, but your author (me!) is politically progressive, and bias is sure to creep in.
- Comments are encouraged, as is disagreement! But please, be kind and respectful, or the comments will be removed.
Let’s continue our journey…
#5: Survey Data’s Great When Audiences Are Correctly Represented (and Awful When They’re Not)
Surveys (which every marketer should use as part of their audience research) and election polls work almost identically. An online form or a phone call is made with a set of questions asking about preferences, behaviors, and characteristics. Those questions are then asked to a sample set of people who mathematically represent the attributes of the much larger, total population of people you care about. In elections, this is often done region by region with demographic inputs like gender, age, race, and education. Marketers at businesses can usually be much more detailed and specific, targeting people with certain job titles, roles, hobbies, purchase habits, etc.
When they work, surveys rock. They can tell you how a broad group of people feel about problems they encounter, habits they have, preferences they exhibit, and more. When we built SparkToro’s software, we ran a series of surveys to thousands of marketers to determine what to build, how to position and talk about it, what to focus on and ignore, and more. Survey responses are invaluable… but only if they truly represent the audience!
In the world of elections, these surveys are called “polls,” and they’re really just trying to measure two things: 1) who will people vote for and 2) which of those people will actually go vote.
There’s a common misperception that election polling has become less accurate over time. The numbers tell a different story.

Via Pew Research
2016 polling is infamous for “missing” Trump’s win, but in reality, national data was quite accurate (Hillary Clinton won the popular vote by ~2% and polls estimated she’d win by 3%, a difference well within the margin of error). The “big” misses came from the three states that gave Trump the electoral college victory: Pennsylvania, Michigan, and Wisconsin, which the Republican won by just 70,000 combined votes, when Clinton was estimated (by the polls) to win by ~3%. There, the polls missed by just over their margins of error.
In the world of audience research for brands, a “miss” of 2-3% would (usually) be inconsequential. Even a miss of 5-10% isn’t going to cause massive problems, because of both how the data’s applied and, more importantly, the stakes. Business, unlike elections, are almost never winner-take-all.
Sadly, many market research efforts aren’t missing by 2% or 10%, they’re missing the whole shebang. That’s because they often ask the wrong questions to the wrong audience(s). We’ll talk about wrong questions in another post; let’s focus on the “wrong audience” today, since it so perfectly aligns with electoral polling misses.
Here’s 2020’s polling averages over time:

Final popular vote forecast from FiveThirtyEight (which aggregates dozens of national pollsters)
FiveThirtyEight’s aggregation of polls (remarkably similar to aggregations by the Washington Post, NY Times, and Politico) estimated Biden would win the national, popular vote by 8%.
Where did reality end up?

4.4%. Just about half the original projection, and within a range where the United States’ electoral college system could give Trump the presidency despite Biden “winning” by more than any challenger candidate since FDR.
That’s a big miss. Margin of error on most national polls is ~2%, so we’re talking 2X, and in the case of many pollsters, more than that. Even worse were some of the individual state estimates.
Over at the New York Times, Nate Cohn did a great job of analyzing where election polls got it right, and where they missed. This graphic summarizes:

Via NYTimes: What Went Wrong With Polling?
The final vote margins are all over the place. In Wisconsin, polls missed by 9%, in Maine, 10%. In Georgia, they missed by only 1%, and Arizona by 2%. The story here is an obvious, if frustrating one: there’s no consistency. Polling worked exceptionally well in some places, and pretty badly in others.
Post-election analyses take numerous different approaches to why polls were off. But they all agree on one thing: some audiences weren’t accurately represented in the process, and that’s why the polls missed. Unlike 2016, there’s no evidence of late-breaking news shifting people’s choices. Nor was there a surprise turnout from unexpected voters. The surveys got it wrong because they didn’t correctly weight the sample populations.
Marketing takeaway: No matter your business, you need audience research data. If you’re not getting it today, and your competitors are, they’re able to make better decisions about product, positioning, marketing tactics, channels, and strategy than you. But, surveys can be fraught with inaccuracy. Bias to the wrong survey takers, and you’ll get bad data about your market. Improperly weight a survey to a particular group, and you’ll end up over-serving that sub-segment of your market at the expense of others.
Chances are, you can afford inaccuracies far greater than what election pollsters can tolerate. A few percentage points off, or a slight imbalance of takers, and your results will still be incredibly useful. The risk is when you miss a part of your audience entirely. This is where lessons from 2020 truly match up. We have to know who is not at the table.

In 2020, pollsters discovered that a certain type of voter wasn’t at the table: people who don’t trust other people. The heavier this distrusting personality trait, the more unlikely it was for a person possessing it to answer a phone pollster or submit information to an online poll. Even with weighting, this audience got missed (no surprise given how exclusively and foolishly pollsters focus on just the demographics).
That problem isn’t limited to elections or pollsters, it’s a challenge for every market researcher, and one reason why collecting data at scale without demanding direct participation is such a valuable addition to the toolbox. If you possibly can, bolster your understanding with data from passive sources like:
- Your audience’s/customers’ email addresses (Clearbit and FullContact can be hugely helpful in appending data to these)
- The social profiles of your target audience (SparkToro is a great place to start, but tools like Followerwonk, Audiense, and Brandwatch can be valuable, too)
- Search data from sources like Google Trends, Moz, or Ahrefs
- Traffic and clickstream data from providers like SimilarWeb, Verto Analytics, and Disqo
Passive data collection lets you understand groups at scale, without the biases of unresponsive or untrusting cohorts.
#6: Making More People Into Target Customers > Convincing Your Competition’s Fans to Change
As a marketer, you’ve got two real options to grow the customer base for your product. You can either:
- Convince more people to switch from their current solution (your competition) to your product
- Convince people who never realized they needed or wanted a solution like yours that they do, and that you’re a great fit to solve it.
In election world, this is a battle between persuasion vs. turnout. Some political consultants believe they’re best served by convincing the small number of swing voters and intendents to back their side. Others think persuasion isn’t as worthwhile an investment as get-out-the-vote efforts, and work to register and provide easy voting access to more people who’ll support them.
Both approaches can work. In 2020, the Biden campaign was able to change enough minds in places like Michigan and Pennsylvania to win the vote, while in Georgia and Arizona, most observers believe turnout was what won those races for the Democrat.
If you’re in the marketing world, how do you know which option is likely to give you the low-hanging fruit and the best chance for growth?
Data.
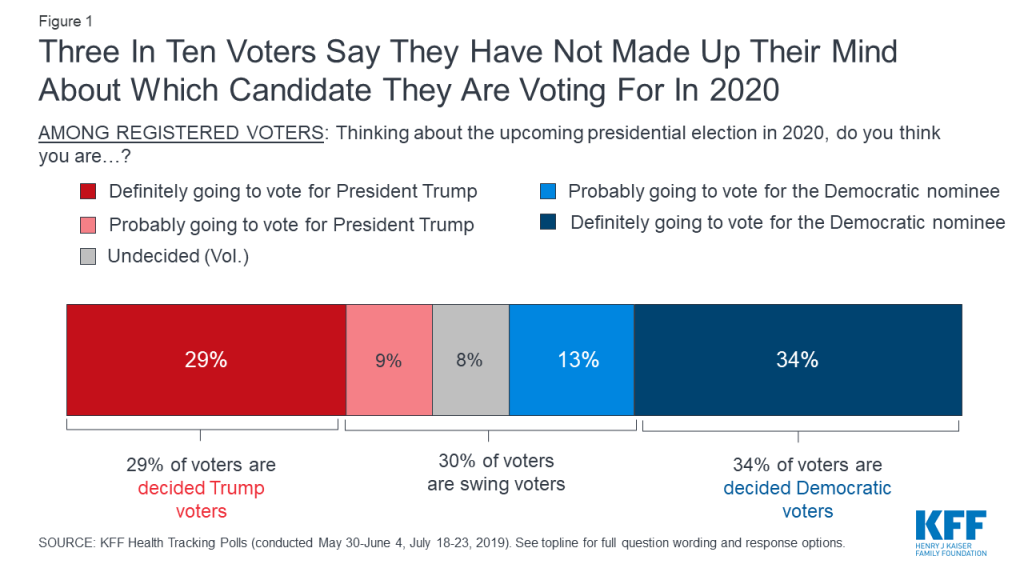
Analysis of Swing Voters in 2020 via KFF
Your best bet is to understand where the opportunity lies by gaining a deep understanding of the current state of your market. Sometimes, this is a cakewalk.
For example, if you’re targeting the baked goods category of snack consumption among Americans, market “penetration” is close to 100%. No matter what you make or how you position it, you’ve got competition. You’ll be necessarily going after the same audiences as many other products and brands filling the same desire and space. That’s not to discount the value of separating yourself from the pack by being unique and talking about your product in unique ways (in fact, you probably have to). But your marketing goal isn’t to “grow the audience of people who would never consume a baked good.” There’s simply not enough of them.
But sometimes, deeply understanding a market’s shape is like pulling teeth.
For example, let’s say you’re building financial tracking software for SaaS businesses (like my friend Patrick from Profitwell). Does Patrick have more opportunity in competing with existing solutions like Quickbooks, Freshbooks, ChartMogul, SaaSOptics, Baremetrics, etc? Or are he and his team better off growing the total market of SaaS businesses and popularizing the concepts of tracking and reporting on metrics unique to the SaaS world?
That’s a pickle.
Search demand data might show us one pattern, while market size estimates report another. Customer surveys could indicate that few of Profitwell’s customers are aware of these other products, but that might only be because they’re targeting and reaching outsiders to the space.
Marketing Takeaway: In 2020, both Biden and Trump’s campaigns invested in both market growth and convincing “undecideds” with surprisingly successful results. Biden received the most votes and the highest percentage of eligible voters of any presidential candidate ever. But Trump’s #2 on that metric, and he substantially beat his dismal polling estimates.
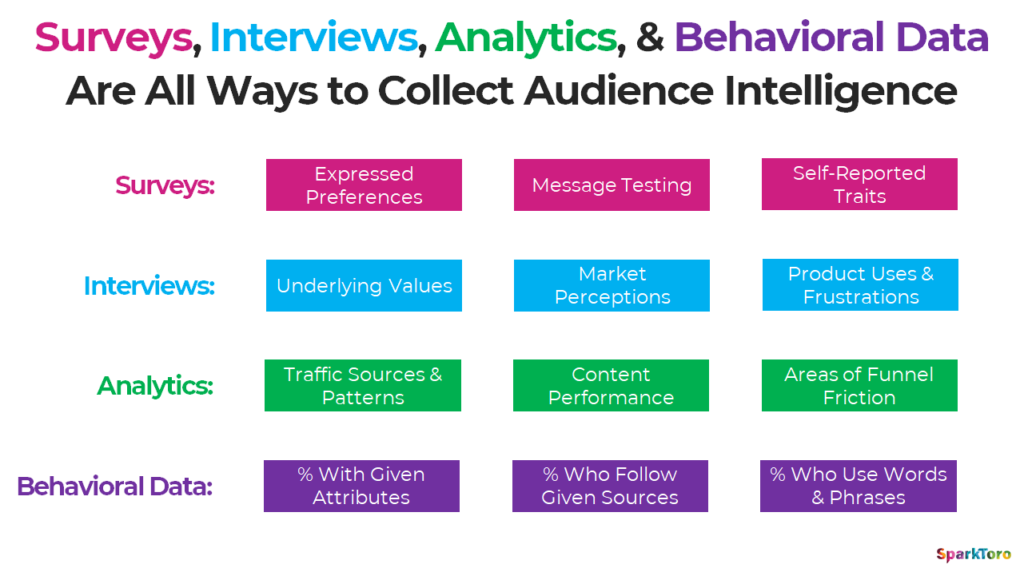
Clearly, both approaches can work, and neither is exclusive. Marketers can and probably should dip their toes into both practices, but only after they gain a deep understanding of their market. The data gathering techniques discussed in #5 above can be hugely helpful: surveys, interviews, and behavioral data, when done right, give marketers the tools to choose the right strategies and balance them appropriately.
If your market leans to saturation and heavy competition, persuasion by standing out from the crowd and luring folks to try your (hopefully superior) product is the way to go. But if your market is new, emerging, or only capturing a small fraction of the total opportunity available, it could be that creating customers by selling people on the problem and the idea of solving it are your path to growth.
SparkToro itself is in that latter group. Tragically few marketers are aware of passively-collected, audience research data at scale, and how it can be applied. My marketing job isn’t to convince folks to switch away from the few, nascent competitors that exist, but to build the total addressable market.
The key is to know which war you’re fighting, and how much to put into either battle.
Thanks for checking out part III in this ongoing series. I’d love to hear from you in the comments below, especially if you disagree or think there’s missed nuance (but, please keep it kind and respectful; political topics can bring out the worst online, so I’ll be especially judicious about pruning).
Stay tuned tomorrow for part IV, where we’ll examine the misleading roll of popular narratives and the information consumption divide.