We Analyzed 118,00 ChatGPT Prompts from 12,000+ Users to Answer: How Do Americans Use AI Tools in 2026?
For the last 4 years, the practice of AI visibility optimization has been in the dark about how many AI assistant conversations are relevant to digital marketers. Today, thanks to the panel of data provided by Verso, who makes opt-in, anonymized connections to OpenAI, we’re considerably closer to an answer.
While search engines like Google and Bing give data (through their advertising products) about the number of searches performed for any given keyword, ChatGPT, Claude, Perplexity, Copilot, and the other AI assistants do not. Google also provides Google Trends, a free tool to compare the volume of queries for particular keywords. But the AI tools have nothing similar. As such, marketers and brands investing in marketing are forced to make wild, impossible-to-verify guesses about the volume of demand for products or services in their sector that happen via an AI conversation. For years, I’ve been seeking an answer to this quandary, and today, have a partial one to share.
Verso cofounder Aaron Aknin reached out to me recently, and provided the data behind this report: 118,163 prompts across 41,961 anonymized, complete ChatGPT conversations between Jan 1–Oct 29, 2026 from 12,321 panel users. I’ve excluded 131 heavy users who averaged more than 33 prompts per month and whose volume was a whopping 21% of the total (as they significantly skewed the dataset). Most of the charts and numbers you’ll see below are per user, rather than per prompt, so that we count every user equally. Also, Verso’s data included rich demographics — gender, age, bucketed household income, and region of the country for a majority of the users.
You can try their ChatGPT-connector-analysis for yourself here: Your ChatGPT, in numbers · Verso — I looked at my own today, and it’s massively different from what an “average” ChatGPT user does; another great reason to never make predictions about broad behavior based on your own. We marketers are outliers!
I’ll begin with a pie chart (a bar chart with the same data is just below for those who prefer) that uses 12 top-level categories that best fit the tens of thousands of analyzed prompts (without being overly granular). As mentioned above, this is per-user data, which helps control for folks in the panel who only ever use ChatGPT for the same topic over and over (like homework or their D&D game).
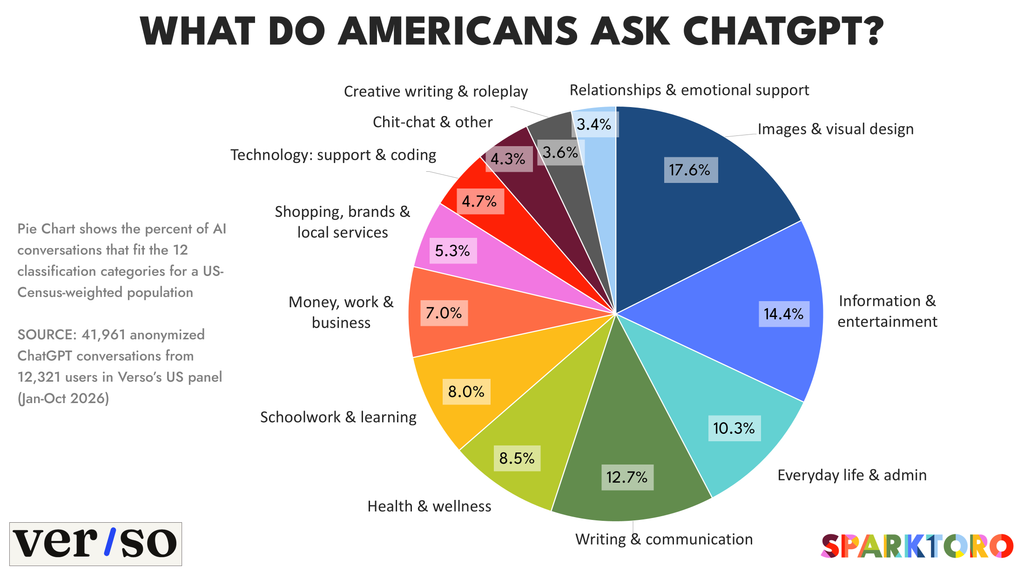
I tried several different categorization types, and found this to be the most helpful and explanatory of how people prompt and converse with ChatGPT. For clarity, I’ve described each of these below:
- Images & visual design (16.1%): Asking ChatGPT to make or change a picture, e.g. editing an uploaded photo (removing an object, making a selfie anime-style), creating an image from a description, or designing graphics (everything from flyers and logos to invitations and tattoos, and yes, even the much-hated AI-generated posters and sandwich boards every mediocre bar in America seems to be using).
- Information & entertainment (14.0%): Curiosity and fact-finding questions, like how something works or whether it’s true. Movies, music, games, celebrities, sports scores, news, betting picks, astrology, tarot, even the meaning of dreams.
- Everyday life & admin (12.2%): The practical tasks of running a household: fixing things around the house, car trouble, pet care, recipes, planning a trip, estimating drive times, navigating bureaucracies — court dates, immigration paperwork, tenant rights, how to get a refund from a shady Etsy shop, all that stuff.
- Writing & communication (11.9%): Getting help with words from (or for) texts, emails, social media, resumes, cover letters. Lots of proofreading and double-checking, and probably a bit too much raw creation (in my personal opinion 😬)
- Health & wellness (10.3%): Questions about symptoms, medications, injuries, pregnancy, lab results, diet, fitness, weight loss, sleep, skin/hair care, and whether that rash is contagious (also 😬).
- Money, work & business (8.5%): Earning/managing money: banking, credit cards, loans, taxes, investing, side hustles, main hustles, getting hustled (oy vey the money-making apps!), job hunting, workplace problems, running a small business (did any chipmaker CEOs ask about the odds their paramour was a spy? I thoughtfully refrained from looking).
- Schoolwork & learning (7.6%): Help with school, mostly homework (maybe AI will finally put an end to the silliness of demanding it), quizzes and discussion posts, studying, or having a common school subject explained (which might not be school, but my classifier assumed it usually was).
- Shopping, brands & local services (5.7%): Deciding what to buy or where to go, e.g. “what’s the best laptop under $500,” comparing products, finding a nearby business, getting hours/phone number/address.
- Technology: support & coding (4.4%): Troubleshooting phones, apps, accounts, software, internet connections, and, of course, writing or debugging code (does this look smaller than you expected? Stay tuned because I specifically broke out tech workers to look at this).
- Relationships & emotional support (3.4%): Advice about partners, family, friends and coworkers, venting, loneliness, and using ChatGPT as a sounding board or stand-in therapist.
- Chit-chat & other (3.0%): Small talk, greetings, possibly just AI testing or asking about ChatGPT itself (my mother-in-law does this constantly), conversations with too little content to classify, and some explicit or prohibited requests.
- Creative writing & roleplay (2.9%): Making something for fun or self-expression, such as stories, poems, song lyrics, jokes, interactive role-play, or gaming.
Here’s a view of that same data in bar chart format, with a twist. I’ve taken the liberty of showing the full panel’s activity, the census-weighted subset (that I used for most of the analyses), and a separate group I’ve labeled tech workers (classified by looking at their conversations and demographic info in combination to infer that they likely work in the tech world):
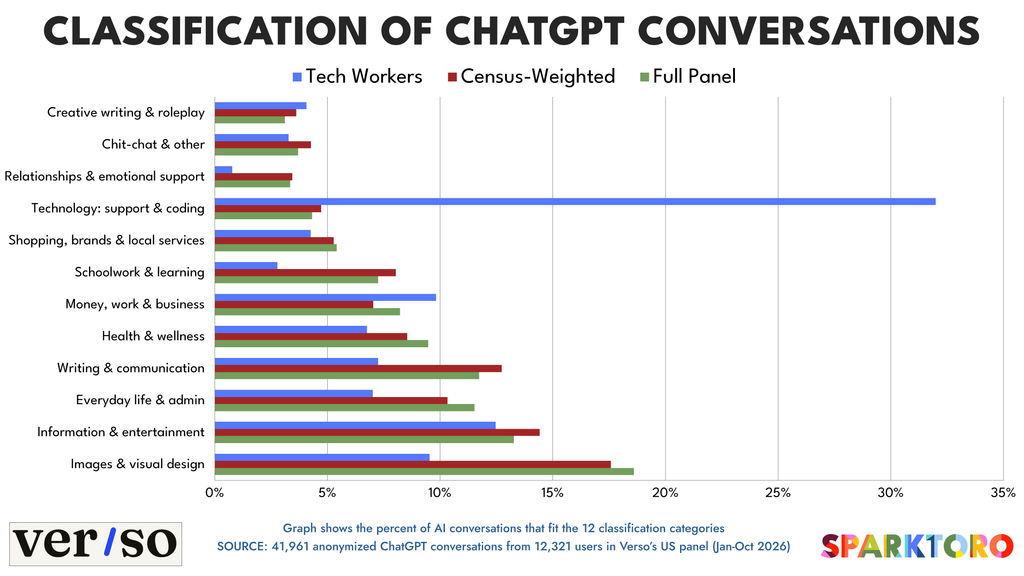
It’s easy to see how the tech set stands out — they’re far more likely to ask coding or technical questions and less likely to ask things around homework/schoolwork topics, generate images, or talk to their AI about relationships/emotional issues (perhaps they realize the AI firms may not always keep their data private).
Brands, Products, and Companies in ChatGPT
My next inquiry was into the appearance of brands — in both prompts given by the users and in the responses given by ChatGPT. I made three classifications: prompts that contained no request for a brand/product/company (i.e. the user wasn’t seeking a recommendation, asking questions about a product or service sector, or doing anything that would be likely to return brands/products in the response), prompts that actively requested these, and prompts that were asking about just one brand/product/company.
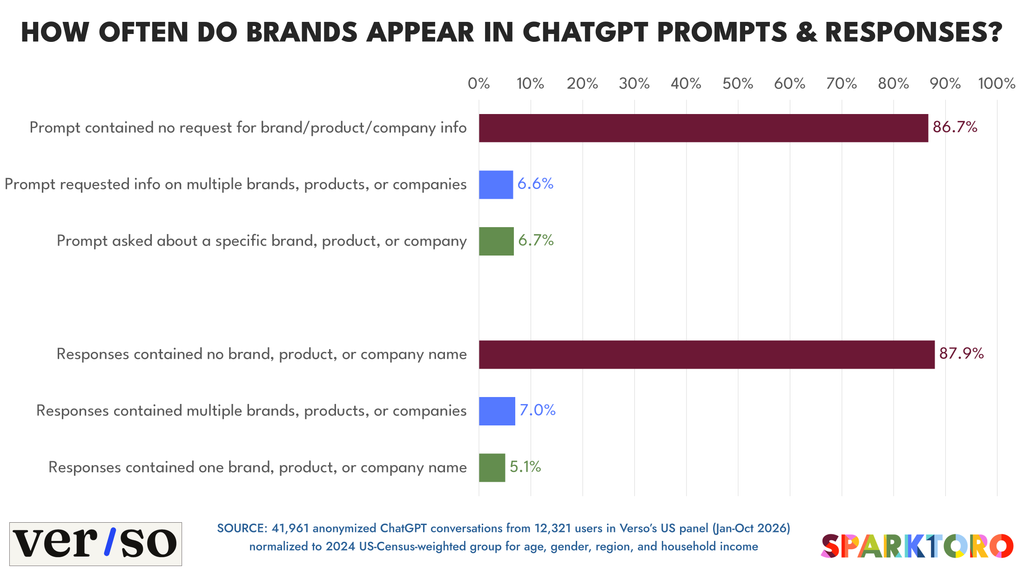
No surprise, the responses contained a brand recommendation a little more often than the user requested it. But the numbers are fairly small — much smaller than the oft-cited statistic from OpenAI’s research about what percent of prompts are “seeking information” (I think they intentionally make their categories very broad to promote a belief that ChatGPT has more brand-related demand than it does).
Still, 12.1% of responses containing one or more brands/products/companies is nothing to shake a stick at, especially given ChatGPT claims to have 330M prompts per day in the US (though this panel uses ChatGPT far less often, but since it doesn’t include API requests, it’s hard to fairly compare).
Next, I examined how this panel’s usage compared to OpenAI’s oft-cited research on the topic. I compared their data from September against the January-October numbers from Verso (with the Census-weighted group), and used OpenAI’s own categories rather than the more detailed ones so we could see them against each other.
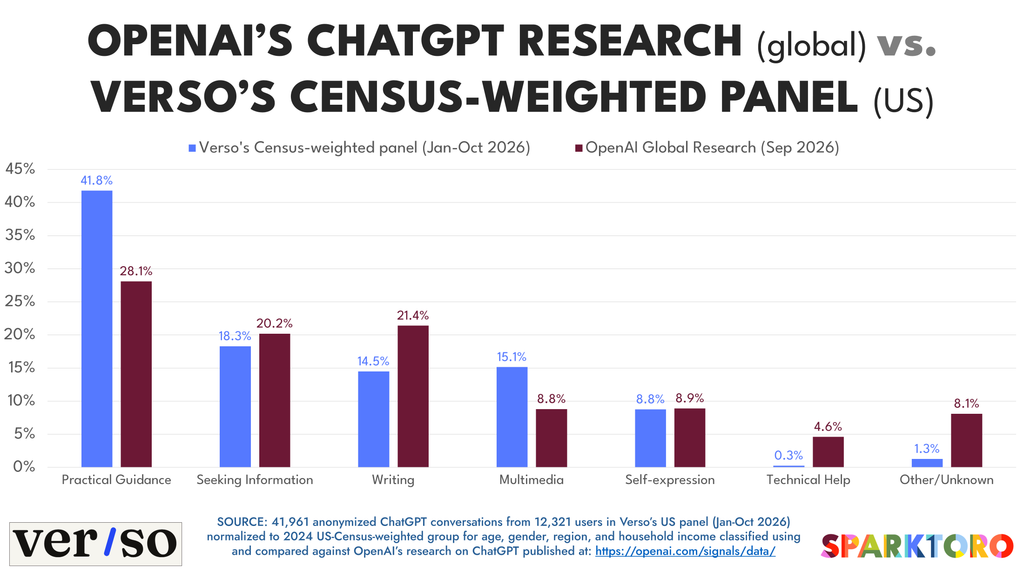
Given Verso isn’t capturing API requests, but OpenAI is almost certainly including them, the comparison appears quite reasonable. OpenAI sees a lot more technical help/coding and other/unknown than Verso’s more consumer-like panel. Consumers are doing more Practical Guidance and Multimedia (like image generation) while OpenAI broadly sees more Writing. Nothing here makes me think Verso’s panel is massively skewed in some problematic direction, and I ran some analyses of the prompts (both with AI classifiers and by hand) just to make sure nothing looked fishy.
The one big takeaway from this section is that if you’re using this data in presentations or reports, make sure to note it’s likely to be more consumer-heavy and less Professional/API-heavy than ChatGPT’s overall American usage.
What percent of conversations have purchase intent?
The last question I had for this data was about the intent to buy or transact. I wanted to know how many of the prompts suggested that someone was in the research, comparison, or decision-making stage of a buyer journey, since that’s what so much of Google’s search engine is used for (and how they’ve become one of the richest tech companies on the planet). If ChatGPT has a lot of buyer-journey research, maybe it is displacing Google, and maybe its nascent advertising business has real potential.
So, I made three classifications: conversations with no purchase intent (e.g. “make an illustration of my gnome wizard for my D&D game”), those with the intent to buy that are researching options (e.g. “best running shoe options for 50 year old men with plantar fasciitis”), and those who are analyzing a single, specific brand, product, or company and asking purchase-relevant questions (e.g. “can SparkToro really tell me where my audience goes online?”).
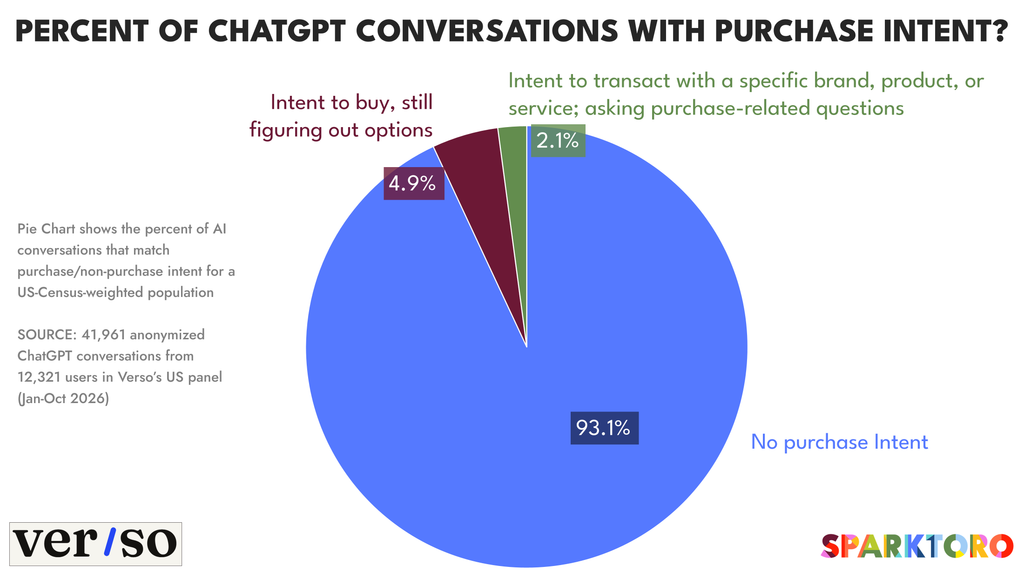
I suspect this is bad news for ChatGPT’s advertising opportunities. Only 6.9% of prompts showed anything related to researching a potential brand to buy from. For comparison, when we looked at 332 million Google queries two years ago, 15%+ matched this definition. Google’s not only 5.5X bigger than ChatGPT in terms of total searches to prompts, it’s also ~2.8X bigger (probably more) in the percent of searches with purchase intent. Conservatively, I’d guess that people ask Google purchase-journey-related queries at 16X+ the rate of ChatGPT. That market share number isn’t dissimilar to the Google:Bing ratio.
Stats, stats, and more stats
If you’re a numbers type, this section’s for you. I’ve broken out the three groups I analyzed from Verso’s panel: the whole entity (minus the ones I removed), the census-weighted group, and the specific tech workers I looked at for the classification of usage categories.
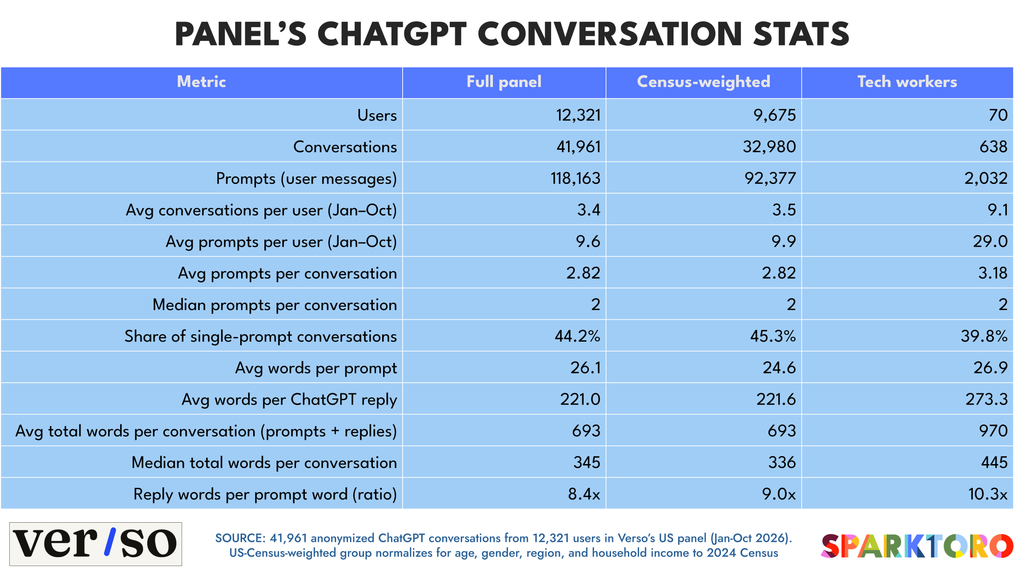
Reminder: I was given far more data than this, but trimmed it down in several ways — removing the 131 outliers responsible for 21% of all the prompts, normalizing to per-person usage, and excluding folks with no demographic data (from the broad group) or whose demographics didn’t align with the US-Census weighting (for that subset). Still, you can see that there wasn’t massive usage differences between these groups. The average prompts/conversation, reply words per prompt, median words per conversation, and similar metrics all were within a tight range.
Rand’s Takeaways
This data isn’t perfect, but it’s a damn sight better than anything I’ve seen since 2023 (when we were still able to see ChatGPT conversations via the clickstream). And it fits nicely with previously published data from OpenAI, which makes me trust that we’re seeing real conversations and able to calculate roughly accurate levels of usage averages. Based on this analysis, I believe:
- ChatGPT is a heavily-consumer app, and anyone who tells you otherwise is wrong. People use it all the time for a massive variety of tasks. We can’t see the API requests, but I’d guess that makes up 50-75% of all usage, and it’s probably sending very different prompts than what consumers do via their phones and desktops.
- The competition with Google has been massively overblown by marketing press and influencers. Going down the list of prompts and conversations will make you realize that this isn’t Google or Bing. It’s not a search engine. People don’t treat it that way. It’s something else: a confidant, a creator tool, an entertainment product, an assistant. Comparing how people use ChatGPT and how they use Google finds far less overlap than my LinkedIn feed suggests.
- That said, 12% of ChatGPT usage is part of the buyer journey. That’s not nothing. It’s just close to the size of Bing than Google.
- AI visibility matters a huge amount! It’s one of the most important marketing things most companies, and especially any B2B business can do. But NOT BECAUSE OF CHATGPT. It’s Google and the Google AI Overviews and AI Mode that makes AI visibility so incredibly important and influential. Is it worth tracking your visibility in ChatGPT? Maybe? But only if you’re also tracking your keyword rankings and AI visibility on Bing. If you think Bing’s too small a market to be worthwhile, but ChatGPT is worthy of your time, budget, and marketing efforts, that’s what mathematics and logic would call: intellectually dishonesty.
I’m very excited about this new data source, hopeful that Verso will continue to grow, and look forward to doing more research and analyses with them in the future. If you’re interested in learning more about them, head over to https://tryverso.ai/.
Methodology Details
The dataset comes from an opt-in panel of US ChatGPT users who consented to share their chat history. It covers 41,961 conversations from 12,321 people between January 1 and October 29, 2026. Before analyzing anything, we removed the 131 heaviest users, anyone who averaged more than 33 prompts per active month. They were only 1% of panelists but sent 21% of all prompts, so leaving them in would have made the results describe a small group of power users rather than typical people. We then built a codebook of 34 fine-grained intents, grouped into 12 broader categories. Each conversation got exactly one label, based on its main goal. When someone asked ChatGPT to produce something (an image, an email, an essay), the output type won over the topic. E.G. “Write a refund email to PayPal” counted as Writing & communication, not Shopping, and “answer these quiz questions about the heart” counted as Schoolwork, not Health.
Every conversation was read and labeled by an AI model (Anthropic’s Claude) working from that written codebook. Labels were not assigned by keyword rules. For each conversation, the labeler saw the auto-generated title, up to six of the user’s prompts, the opening of ChatGPT’s first few replies, and any product or place cards and bolded names in the replies. That let it also record whether ChatGPT recommended two or more specific brands, and whether the user asked about a specific brand in a way that could steer them toward or away from it. To check the labels, a second, independent labeler re-coded a random sample without seeing the first labels. The two agreed on 90% of category labels (κ ≈ 0.88) and on 97–99% of the brand tags. Most disagreements were near-misses between neighboring categories, like general knowledge versus schoolwork. The second rater flagged brand questions more often than the first, so our brand-question figure is probably conservative. Rand also hand-checked these numbers and saw greater than 98/100 accuracy (though he’s probably less precise than Claude at this point).
Like any opt-in panel, this one doesn’t perfectly match the US population. It skews younger, female, and lower-income. To test whether that skew changed the findings, we weighted the 9,675 panelists who had demographic records to 2024 US Census targets for age, gender, region, education and household income. No category moved by more than 1.4 percentage points. We also looked at results two ways: “share of conversations,” which counts every chat equally, and “per person,” which takes each user’s own mix and averages across users, so frequent chatters don’t dominate. The two views tell essentially the same story. Most panelists were recorded on phones, so desktop and work-account use is likely underrepresented (though we controlled for this using estimation). And this panel tells us what people ask ChatGPT far better than how much they use it (because API requests are missing and desktop/laptop usage may be under-represented).