A SparkToro report describes the audience you researched across several sections: their demographics, the social accounts they follow, the websites they visit, the podcasts and YouTube channels they tune into, the apps and platforms they use, and the keywords, brands, and topics associated with them.
How to read the numbers:
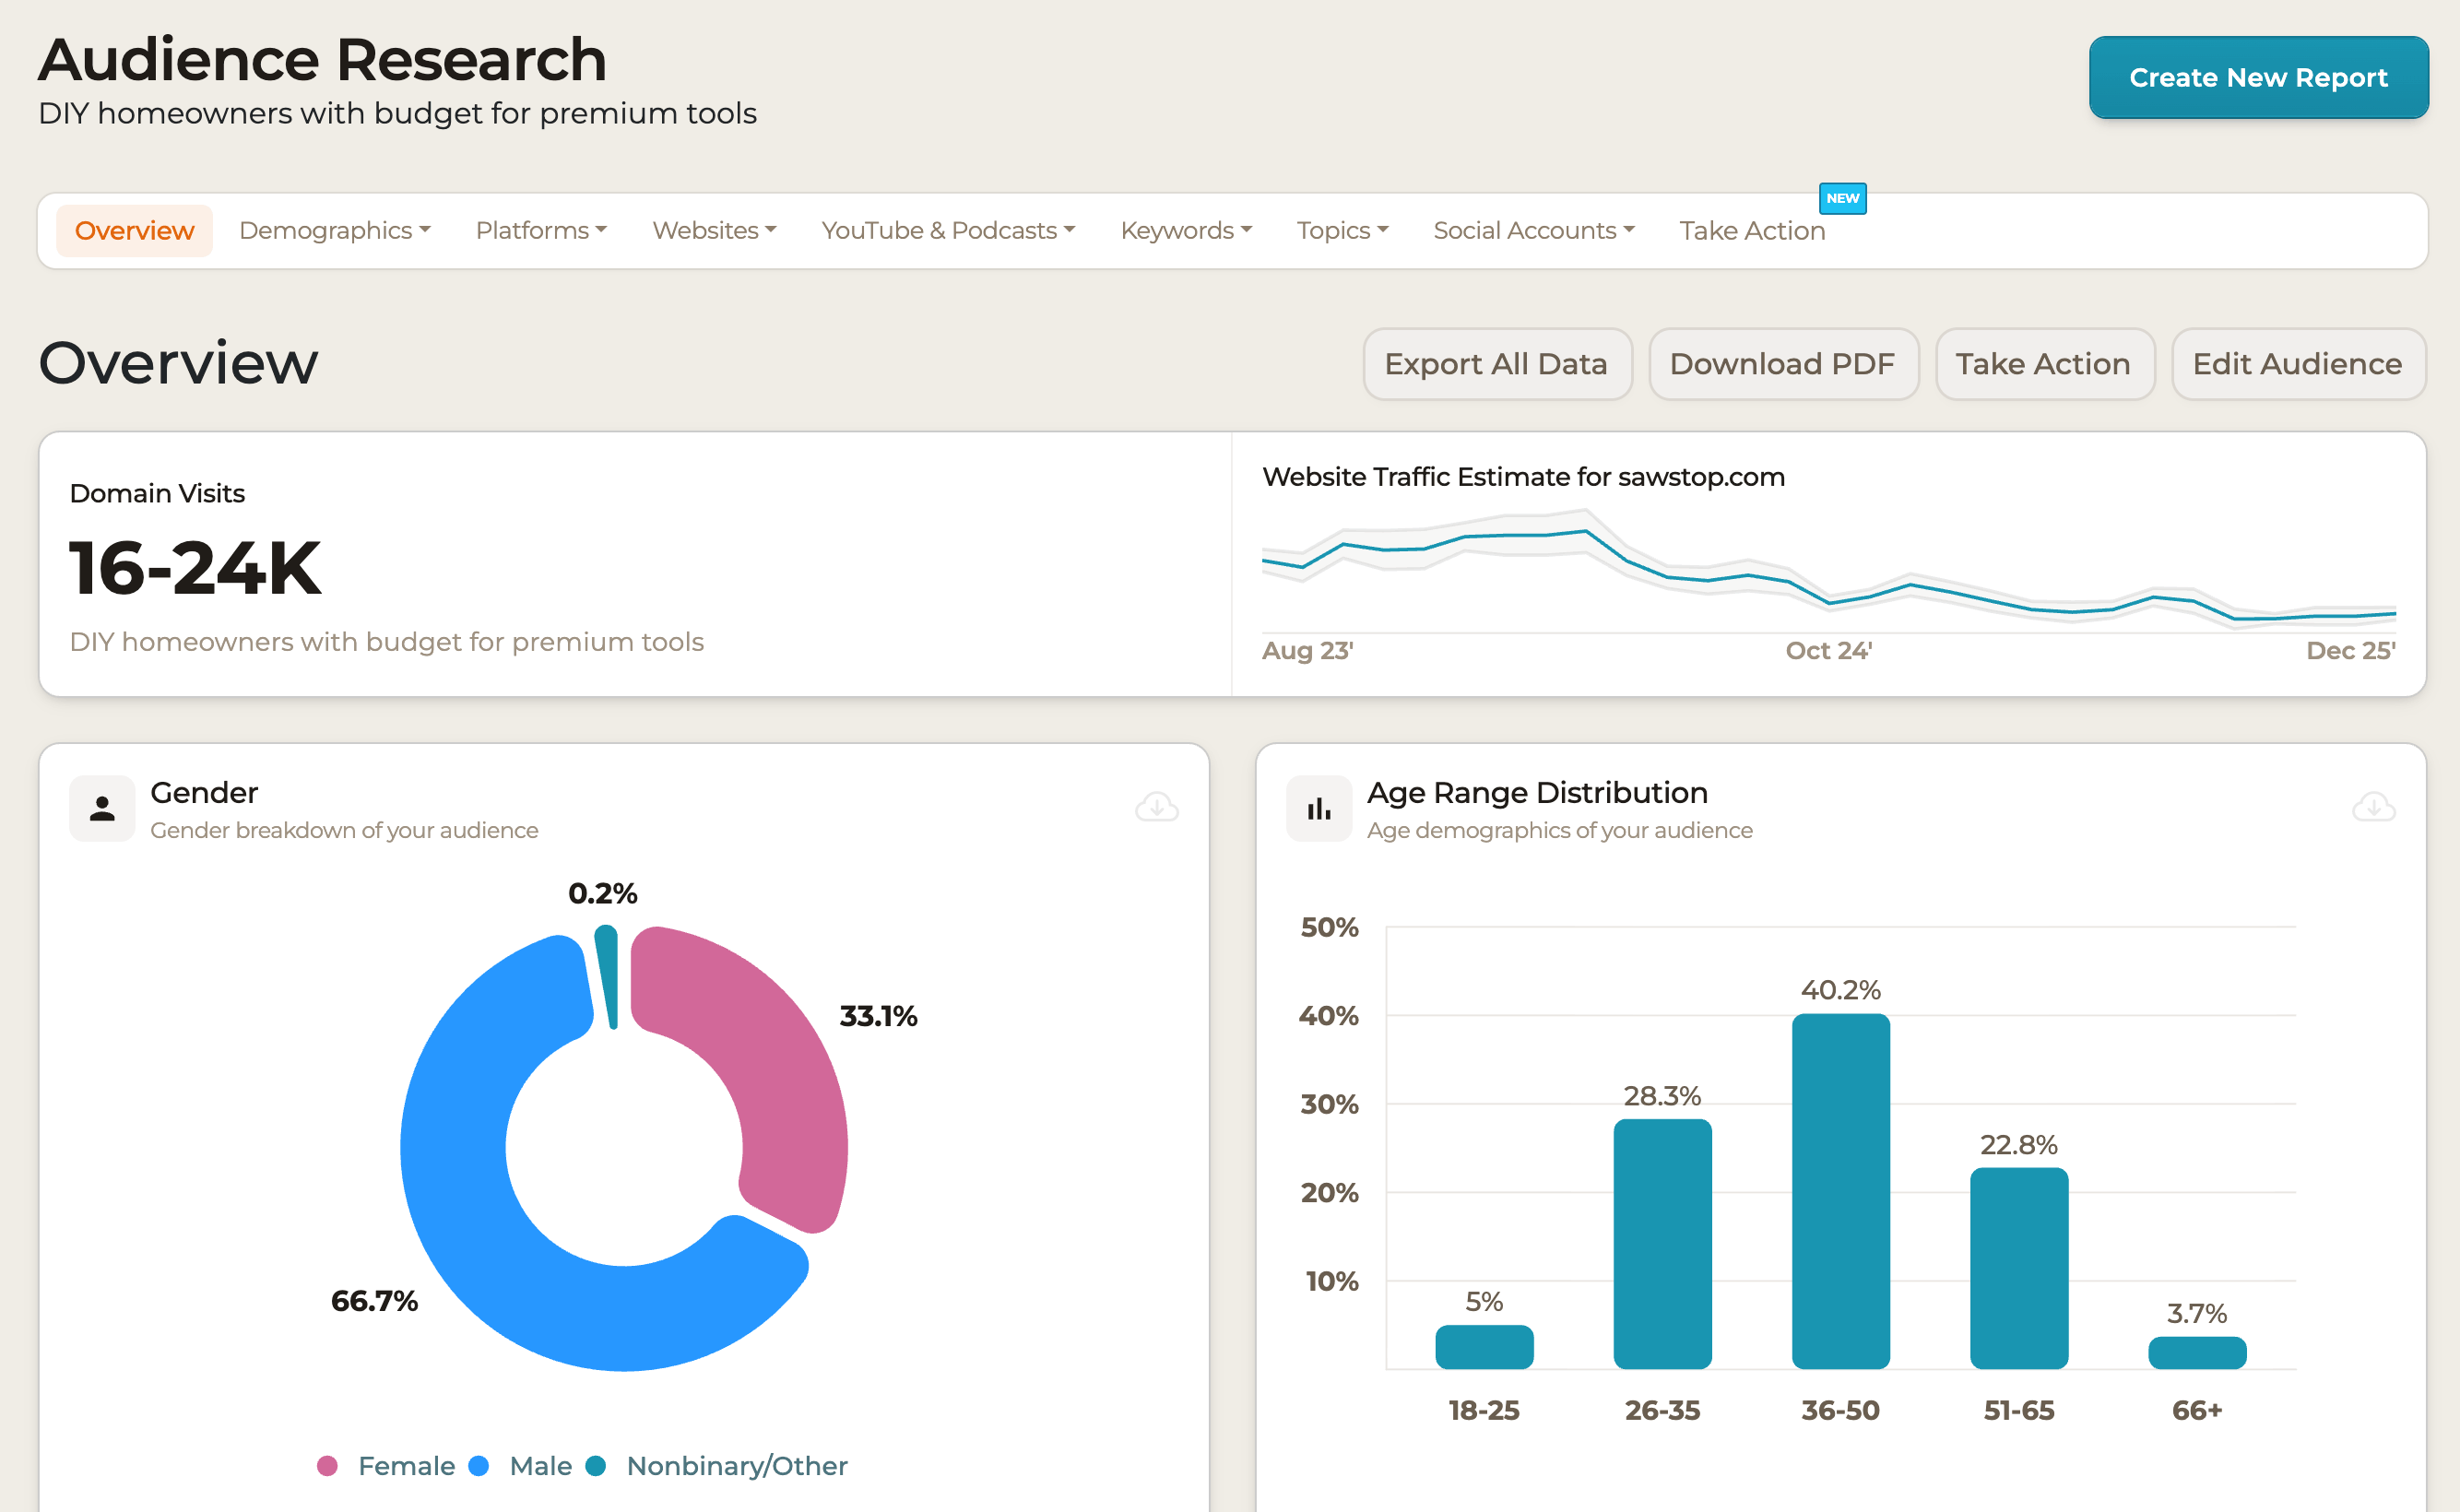
- Percentages indicate how much of the audience engages with a given source, relative to the audience you researched. Higher means more of that audience pays attention to it.
- Rankings are relative within your report, not a global popularity score.
- Use the results to find where your audience already spends attention, then prioritize the sources that are both relevant and reachable.
For context on how the underlying data is gathered, see how SparkToro finds its data and accuracy and bias.