The BRAND New V3 of SparkToro Is Here
A new version of SparkToro, our 3rd major iteration since the product’s first launch in 2020, just went live today! In this new version you’ll find:
- A completely overhauled interface, design, branding, and navigation system for the website and the audience research application, including an upgrade to the new, My Projects, homebase inside SparkToro
- New charts, graphs, and data visualizations throughout the SparkToro app.
- Upgrades to dozens of research report elements, including additional data, data types, graphing options,
- A revamped “Take Action” area re-titled “Workspace” that lets you complete editorially-curated and AI-powered marketing tasks informed by the audience research in any report.
- A brand new Help Hub, filled with upgraded, more detailed support answers, a host of new product demo videos (all featuring unique neckwear from yours truly)
- New information about our just-released API & MCP server options, including detailed documentation for both
Maybe it would have been shorter to fill you in on what hasn’t been upgraded 😅…. which is basically just the Lists feature and the pricing (though we’ll be changing the latter in the next couple months, so lock in now if you want these 2020-era rates). If you’re looking for a fast, comprehensive way to get acquainted with the basics of SparkToro V3, this fella can help:
The good news is that nothing’s so different or so obtuse that it can’t be figured out in a few seconds. Our wonderful designer, Jennifer Morgan from Fan Club Brands, helped create a visual language for the brand and UI that’s as intuitive as it is beautiful, and Casey translated that into a familiar-yet-fresh overhaul.
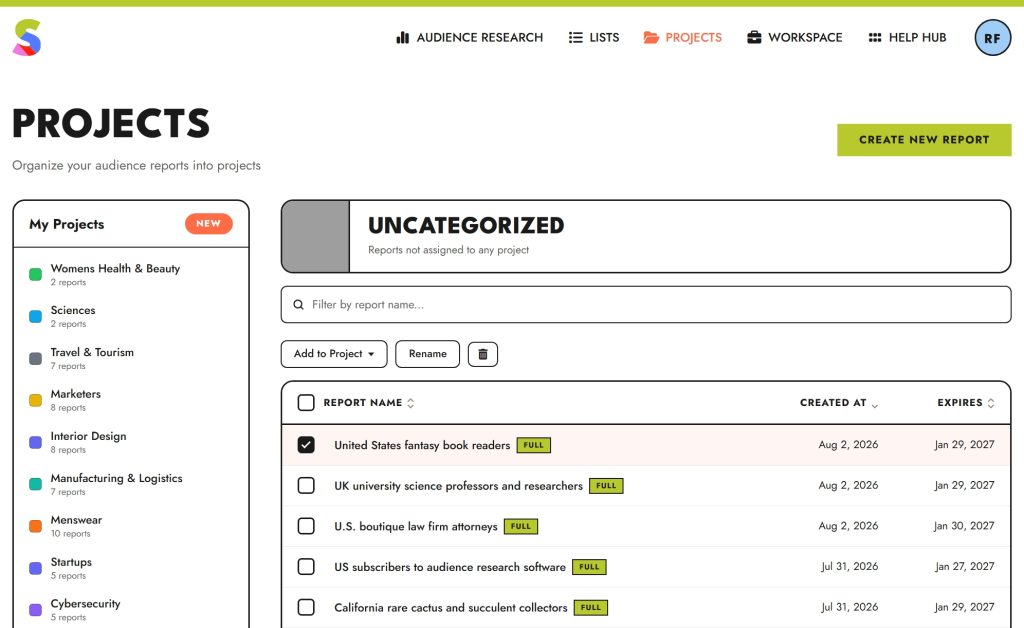
Check out the new Projects page, purpose-built for those of you who, like me, just love making your own, color-coded categories to make for clean, professional reporting tableaus:
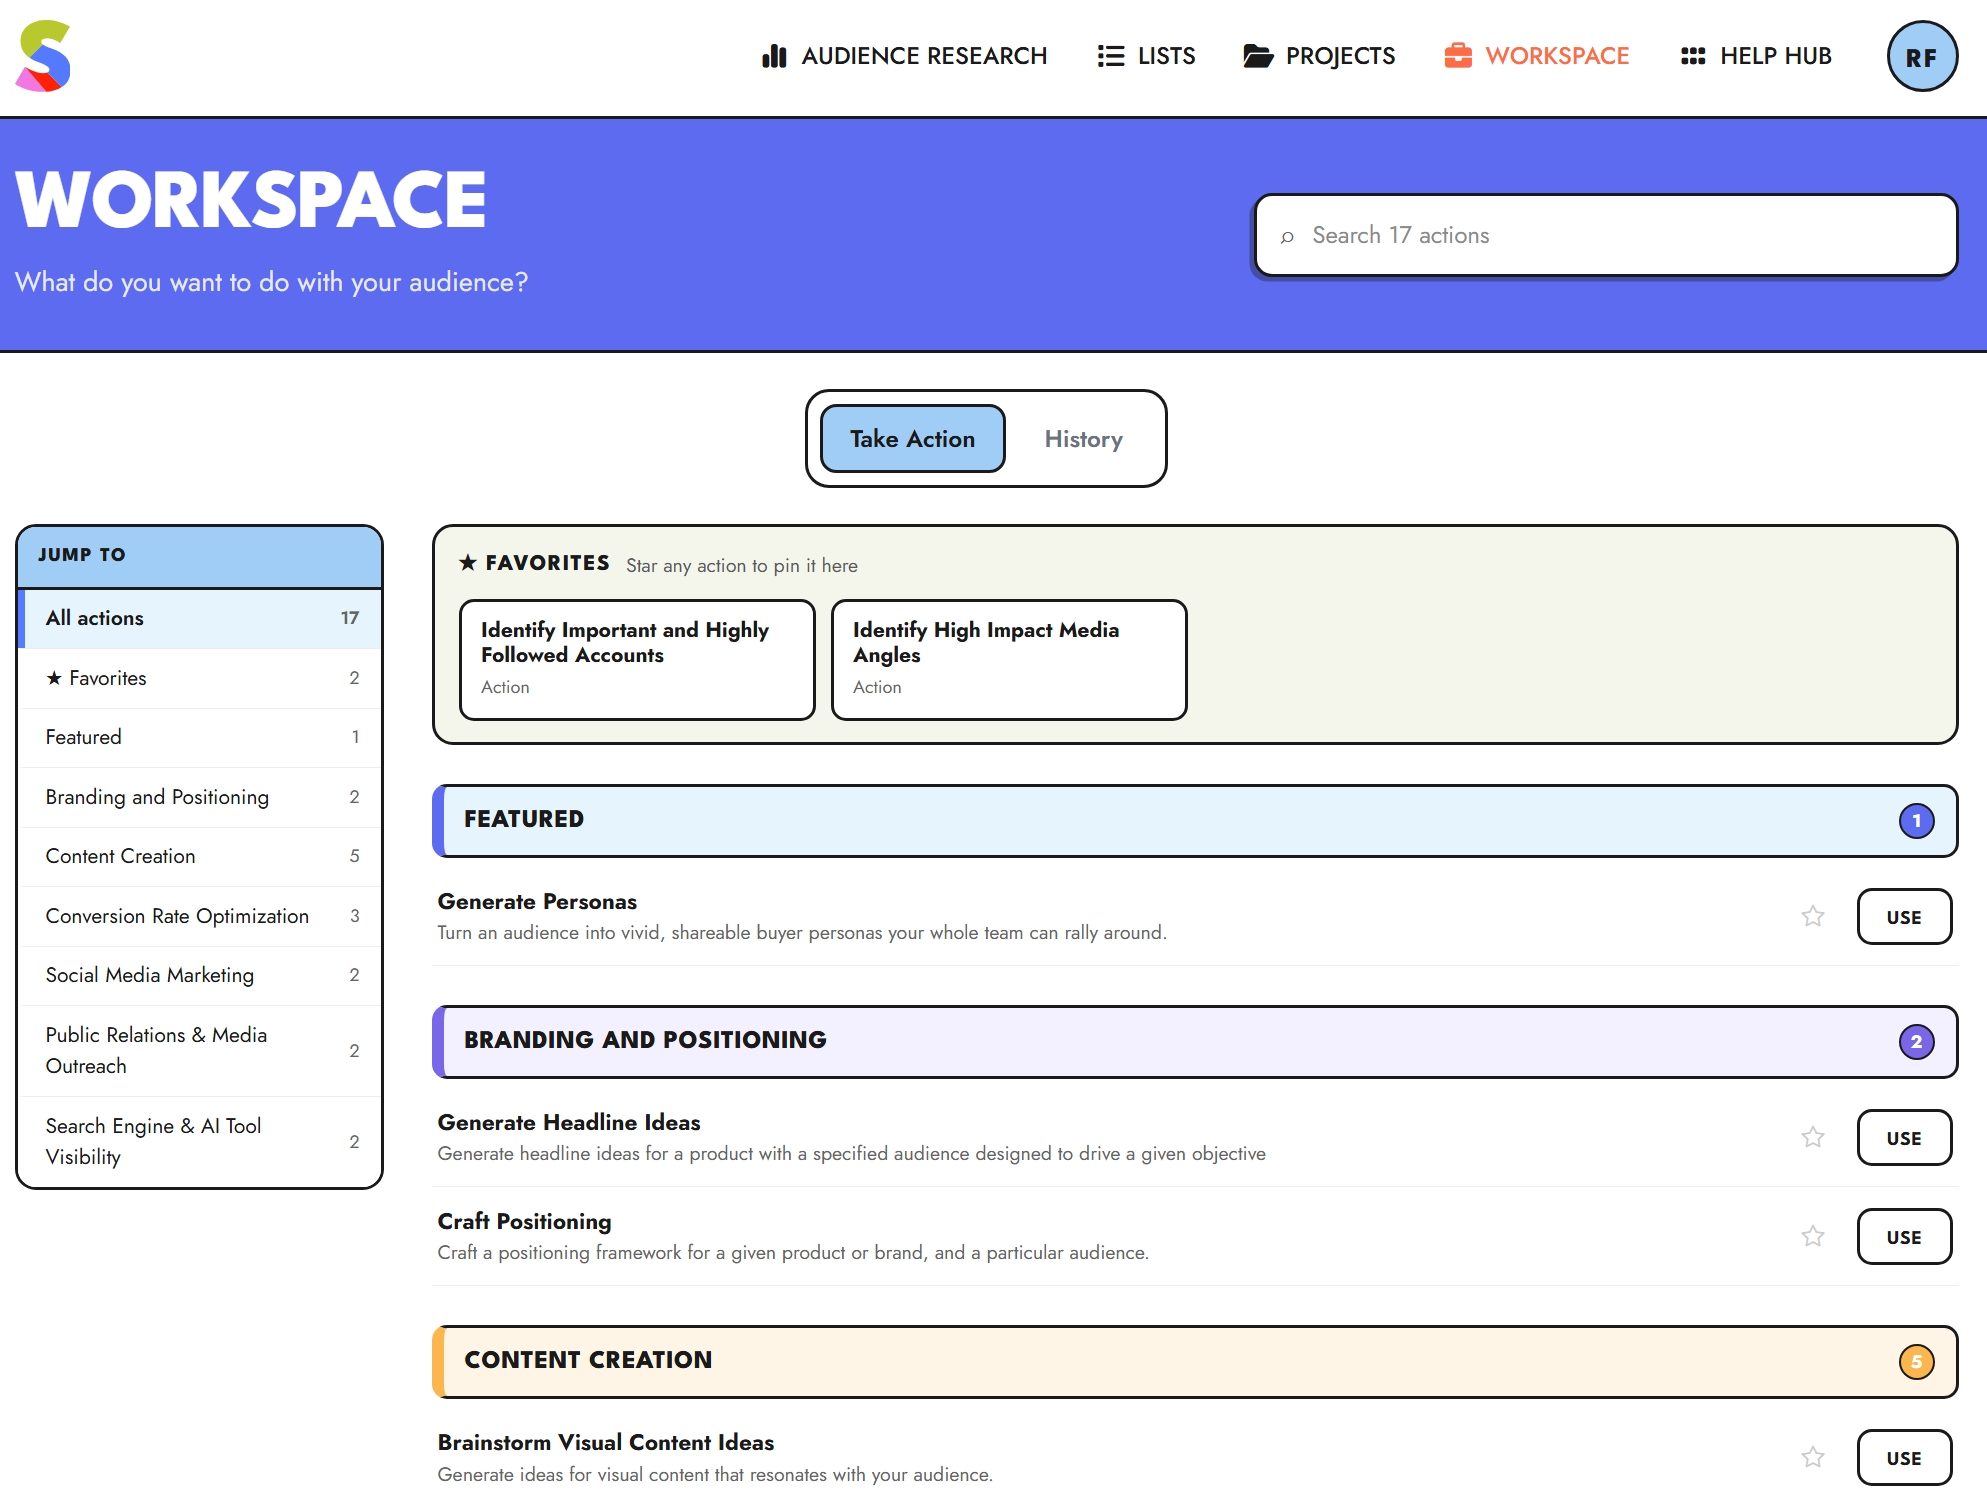
And sneak a look at this thoughtfully-organized new Workspace, where actionable tasks can be called up for any report (or combinations of reports) you’ve run:
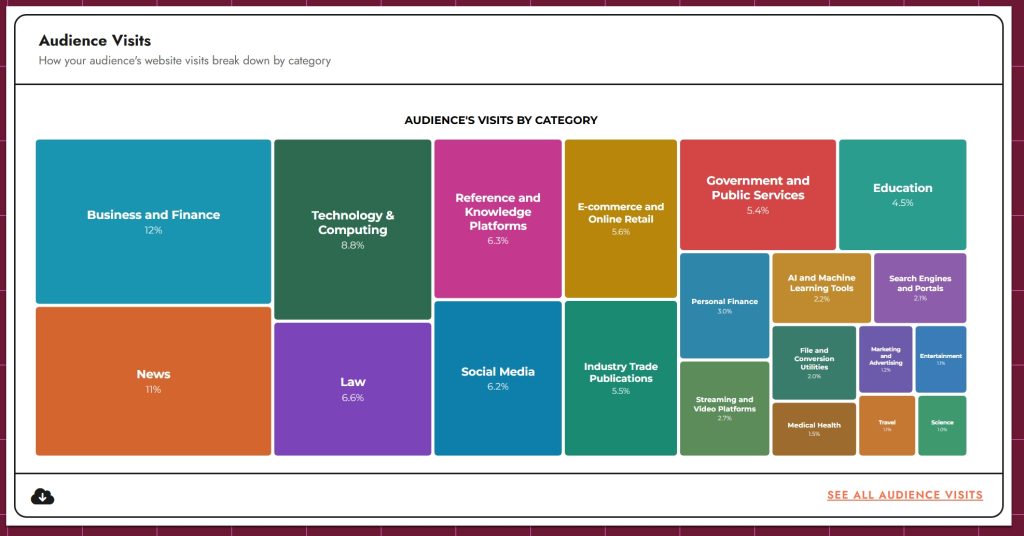
And finally, have a gander at one of my favorite new data visualizations in the app — the audience visitation by category:
There’s obviously a metric ton more to see in V3, and I’ll be showing off more of it in the weeks ahead, so stay tuned.
As I’ve been heavily using the new site and application over the past couple weeks, I’ve been surprised at how little I needed to think about where I was going, what I wanted to do next, or where to find it. This version of the product, far more so than V1 or V2, flows from task to task, for which I’m deeply appreciative. But, that’s not to say there won’t be imperfections, issues, even the occasional bug, so please, if you find anything out of place or struggle anywhere, just drop us a line (support at sparktoro.com).